8.2 How are you different?
Since so little about the microbiome is well-understood, most of the time it will be hard to interpret your results by themselves.
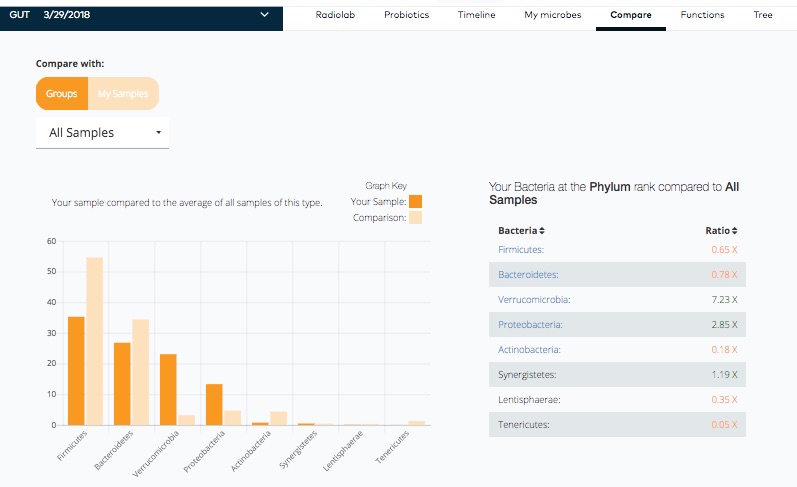
Figure 8.3: The Compare view shows the differences between my sample and others in the uBiome database.
In this case, I can see that my sample has about 65% of the abundance of Firmicutes as other people in the uBiome database. You can sort this field by abundance (ratio) and click on the various taxonomic categories to dig deeper into your microbiome and find microbes that are particularly rare in your sample.
More significantly, see my levels Proteobacteria, which is 2.85 times higher. As we’ve discussed previously, this group of microbes contain a number of pathogens, so a higher level may be associated with some type of gastrointestinal distress.
I have 7.23 times higher Verrucomicrobia than other people. In human guts, this phylum is nearly always limited to a single species, Akkermansia muciniphila, which is generally considered a “good” microbe, but like everything else, the dose is the poison. You don’t want either too much or too little of anything.