9.1 Gut Microbiome
Which are the most common gut taxa? Let’s look first at Phylum level
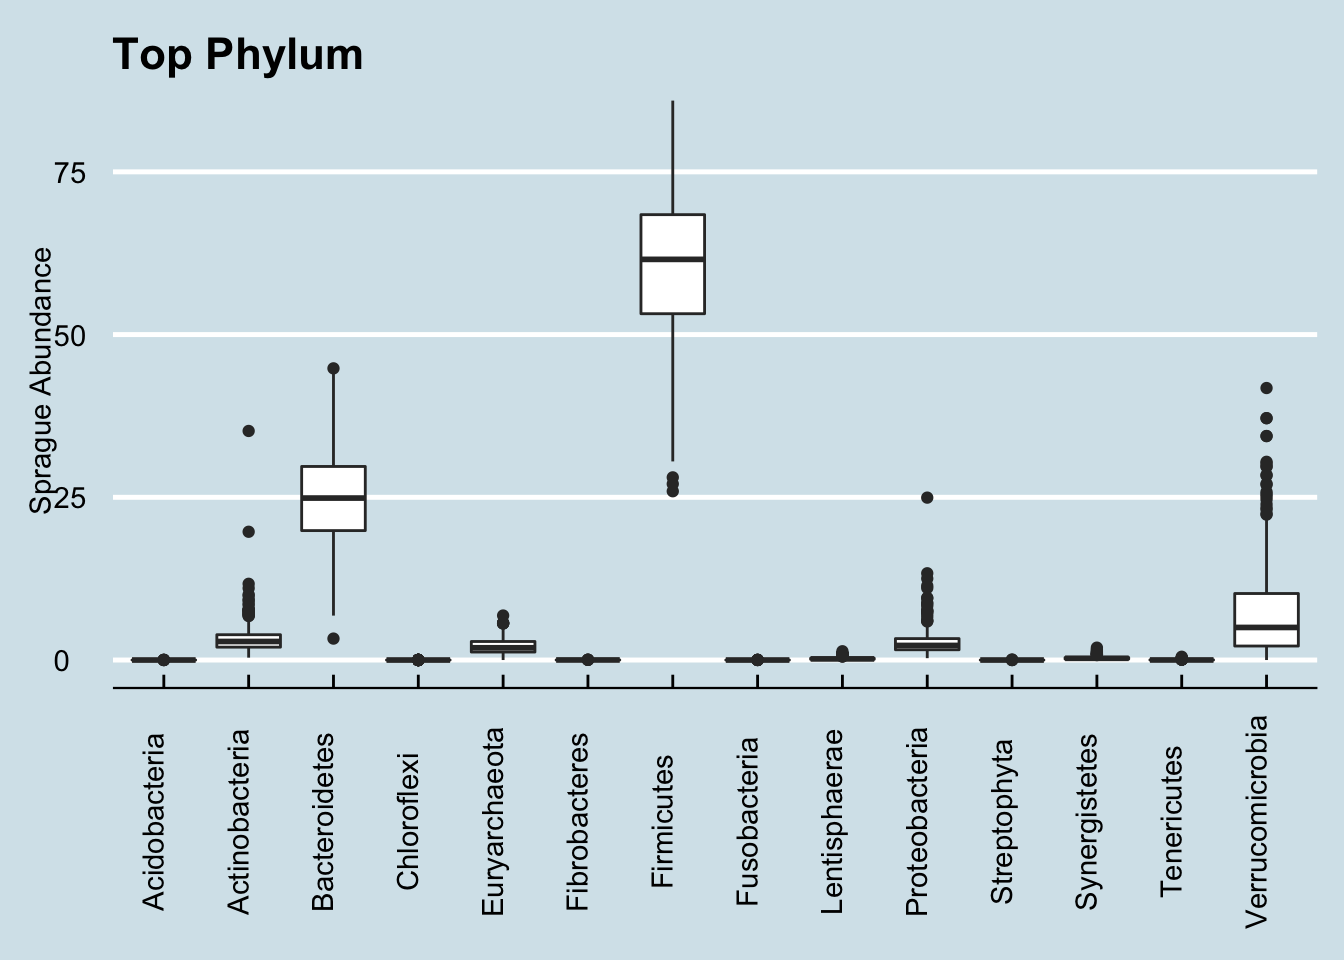
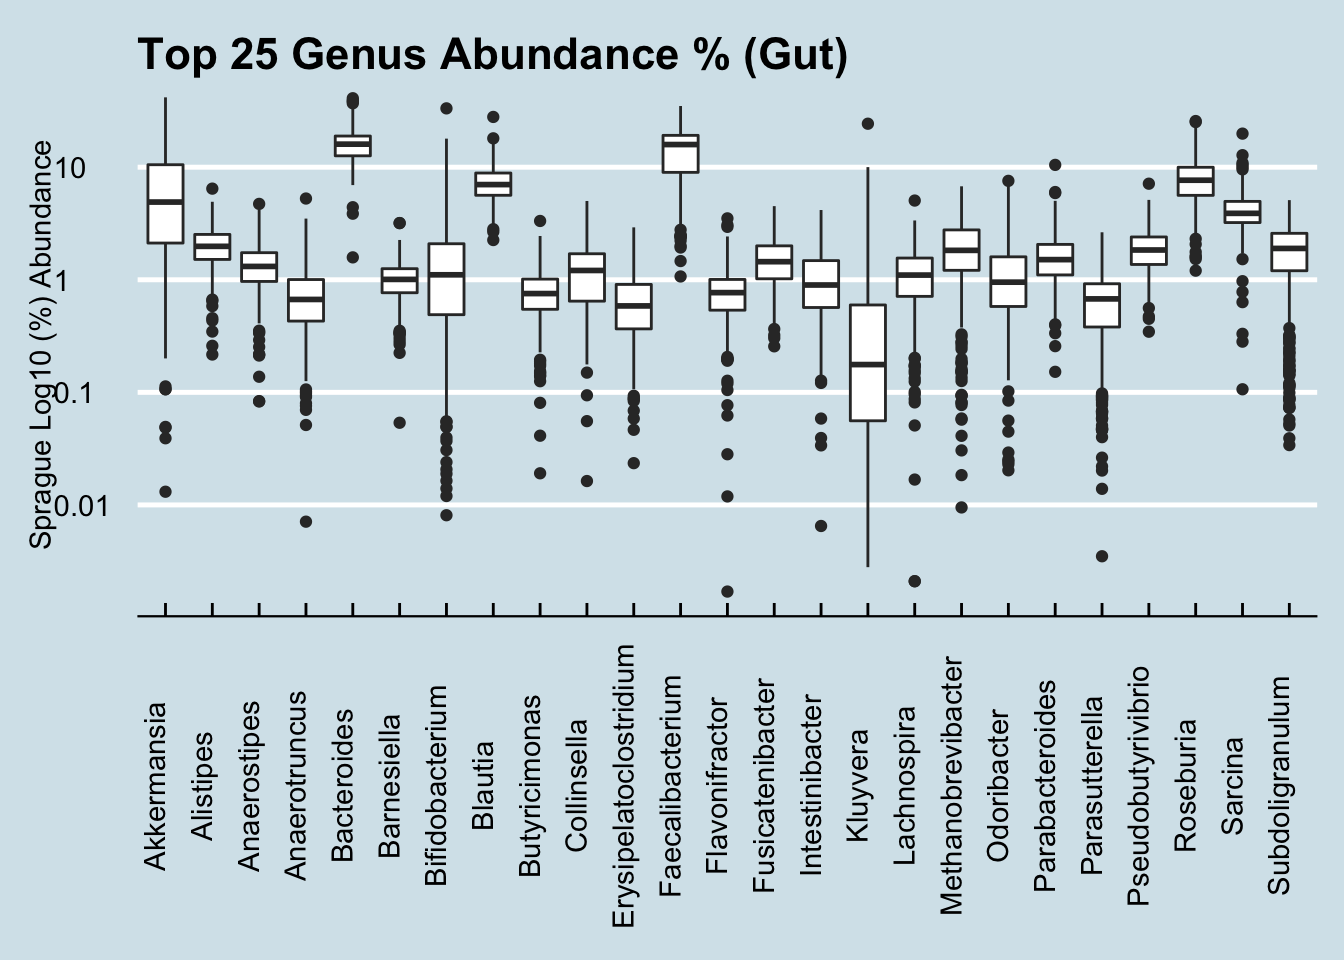
In these boxplot charts, the long box in the middle represents a range between 25 and 75 percentile. The line in the middle of the box is the median, and the other samples are shown as dots outside the middle 50%. The Y-axis uses a log scale to make it easier to see the more rare taxa.
The Genus level reflects this with more detail, and variability: