3.14 Collection methods
To understand a result, we need to know more about the overall variability of the microbiome. As we showed previously, the day-to-day changes can be substantial, but what about variability in the sample itself? To find out, I tried sampling the same, uh, evacuation in several different ways. (Warning: some of the discussion here may get a little precise).
I submitted two swabs to the lab. One of them I simply poked somewhere in the middle of the sample. In the other, I placed the entire sample into a plastic bag and gently “blended” it as best I could, rolling and kneading it back and forth until it was as mixed as I had patience to try. Here are the results at the genus level:
| Middle | Blended | |
|---|---|---|
| Roseburia | 19.80 | 17.88 |
| Blautia | 12.45 | 5.87 |
| Bacteroides | 9.96 | 14.08 |
| Faecalibacterium | 6.33 | 15.93 |
| Sarcina | 4.41 | 3.13 |
| Intestinibacter | 3.51 | 0.55 |
| Collinsella | 2.33 | 1.60 |
| Alistipes | 1.84 | 2.82 |
| Kluyvera | 1.83 | 2.63 |
| Odoribacter | 0.99 | 2.72 |
As we can see, there is a significant difference. If you are merely swabbing from a single wipe, it’ll clearly matter a great deal that you wipe consistently from sample to sample.
Sometimes I’ll have more than one chunk in the same “session”. Here’s what happens when I wipe from the first chunk and then the second:
| First | Second | |
|---|---|---|
| Akkermansia | 32.51 | 9.11 |
| Bacteroides | 11.85 | 6.94 |
| Faecalibacterium | 9.27 | 15.52 |
| Sarcina | 5.07 | 7.14 |
| Roseburia | 4.50 | 7.01 |
| Blautia | 4.48 | 7.36 |
| Parabacteroides | 2.70 | 1.69 |
| Bifidobacterium | 2.11 | 5.49 |
| Methanobrevibacter | 1.79 | 5.10 |
| Alistipes | 1.68 | 2.17 |
But what if I sample twice on the same day? Although I tend to be a once-a-day guy, there are occasions when I’ll need to go more than once and I have a few examples with data from the same day.
| Day 1 Morning | Day 1 Afternoon | |
|---|---|---|
| Bacteroides | 16.51 | 15.00 |
| Blautia | 8.29 | 6.73 |
| Roseburia | 7.08 | 7.00 |
| Akkermansia | 6.93 | 8.43 |
| Sarcina | 5.83 | 4.17 |
| Faecalibacterium | 2.70 | 20.16 |
| Alistipes | 2.54 | 2.54 |
| Parabacteroides | 1.39 | 1.37 |
| Fusicatenibacter | 1.00 | 1.68 |
| Methanobrevibacter | 0.09 | 3.60 |
| Day 2 Morning | Day 2 Afternoon | |
|---|---|---|
| Faecalibacterium | 21.51 | 19.55 |
| Sarcina | 8.77 | 5.74 |
| Bacteroides | 8.73 | 17.59 |
| Roseburia | 8.41 | 5.64 |
| Blautia | 8.32 | 6.32 |
| Akkermansia | 3.51 | 4.89 |
| Pseudobutyrivibrio | 2.84 | 2.40 |
| Anaerostipes | 2.82 | 1.74 |
| Subdoligranulum | 2.64 | 2.36 |
| Methanobrevibacter | 1.81 | 1.69 |
| Day 3 Morning | Day 3 Afternoon | |
|---|---|---|
| Faecalibacterium | 21.88 | 24.14 |
| Bacteroides | 13.17 | 16.84 |
| Roseburia | 9.67 | 7.46 |
| Blautia | 8.67 | 7.45 |
| Bifidobacterium | 7.49 | 5.03 |
| Sarcina | 3.12 | 1.96 |
| Subdoligranulum | 3.02 | 2.79 |
| Lachnospira | 2.03 | 2.31 |
| Fusicatenibacter | 1.83 | 2.12 |
| Akkermansia | 1.36 | 1.76 |
Or maybe it’s just me. Something odd about my own microbiome, perhaps, or just something related to how I sample?
Here’s another sample somebody sent me, two swabs from the wipe:
| Sameday1 | Sameday 2 | |
|---|---|---|
| Roseburia | 32.46 | 27.09 |
| Faecalibacterium | 9.21 | 10.22 |
| Bacteroides | 8.02 | 9.62 |
| Blautia | 6.30 | 6.68 |
| Sarcina | 4.41 | 4.35 |
| Collinsella | 1.95 | 1.89 |
| Pseudobutyrivibrio | 1.93 | 1.68 |
| Anaerostipes | 1.70 | 1.72 |
| Barnesiella | 1.69 | 1.94 |
| Thalassospira | 1.38 | 1.92 |
Same day, very different results. My conclusion is that to ensure results are comparable, you must be extra careful to adopt similar methods across samples. My advice is to never rely on a single test; always get more than one sample, and don’t make conclusions unless you’ve seen multiple results, often over several days. And when you do take a sample, try to move the swab through as much of the DNA as possible. It’s not as convenient, but unfortunately this means taking a chunk (not a wipe) and swabbing throughout. Generally, the more DNA you can collect, the better.
Ultimately the real lesson is to be humble about what we can learn from a single sample while simultaneously noting that there is a signal in the noise. After hundreds of samples, I see variance, but not too much variance. There really is a distinct signal in my microbiome, one unique to me, and worth uncovering.
| Diversity | Location |
|---|---|
| 2.817829 | Blended |
| 2.777073 | Middle |
Scientists at uBiome released results from experiments testing the variability of gut samples. My own experiments show considerable day-to-day variability, so I was interested to see their conclusions, which are based on much more rigorous testing.
The preprint, titled Measures of reproducibility in sampling and laboratory processing methods in high-throughput microbiome analysis finds these high-level results:
Sampling method isn’t that important. Gut stool is not homogeneous, so you’d expect some variation in abundances depending on where and how you wipe, but when they systematically tested one person 11 times, they found the differences from the same day were small. Samples taken the same day were 0.95+ correlated; those taken from the same individual on different days were 0.60+ correlated – much higher than the correlation between different people.
Storage conditions don’t matter (much) either Whether you store the samples frozen, at room temperature, or in hot weather, your results won’t be different enough to make them invalid.
Sequencing results are pretty consistent. Turning a microbiome gut sample into usable data requires dozens of precise steps, any of which can potentially skew the results, but at least in uBiome’s lab pipeline, the final results are highly reproducible.
All of this is good news to people hoping for important insights from their microbiome testing, but it still left me with some questions.
The paper doesn’t describe exactly how they tested the person (“Subject A”) who they found had consistent results over time. This is an experiment I’ve tried too – over 25 samples worth – and meanwhile several people have sent me the results where they happened to test twice. Can I replicate the uBiome results?
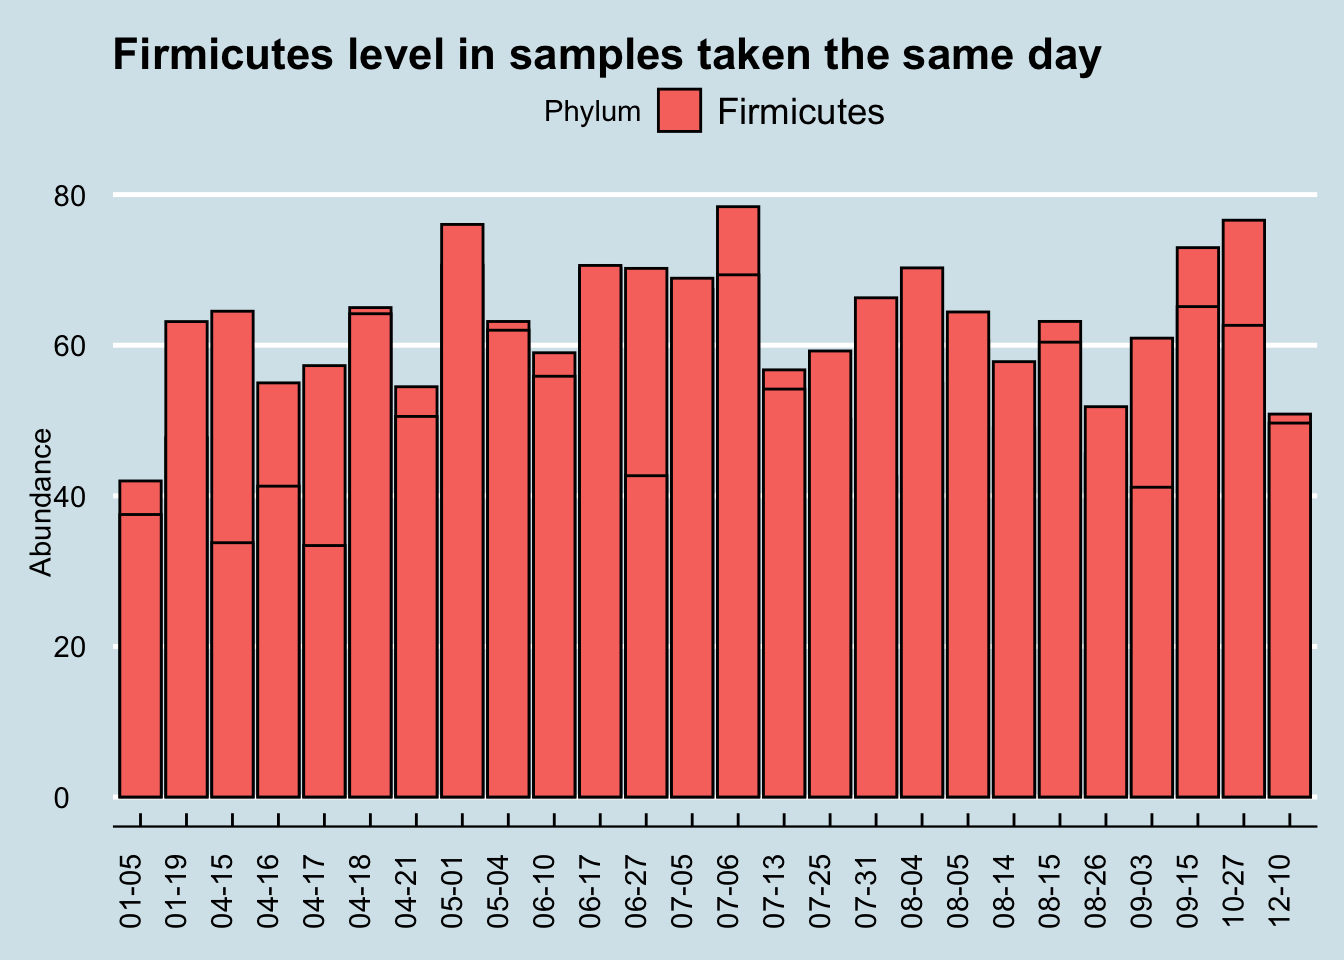
Let’s start by looking at a single Phylum, Firmicutes, which is usually the most common in western guts. This is the highest-level taxanomical ranking as well, so the 16S method used in the uBiome pipeline should be pretty accurate. Using the 25 samples of which I have duplicates taken the same day, I’ll compare the first sampling (“Sample1”) with the second “(Sample2)”.
When we eyeball it, the Firmicutes doesn’t appear to vary a whole lot between the same-day samples. The black lines in each of the bars is the level of Firmicutes found in the second sample. Although there are a few significant exceptions (10-27, 04-15, 6-10), most of the time the levels for this microbe seem pretty close no matter where you sample.
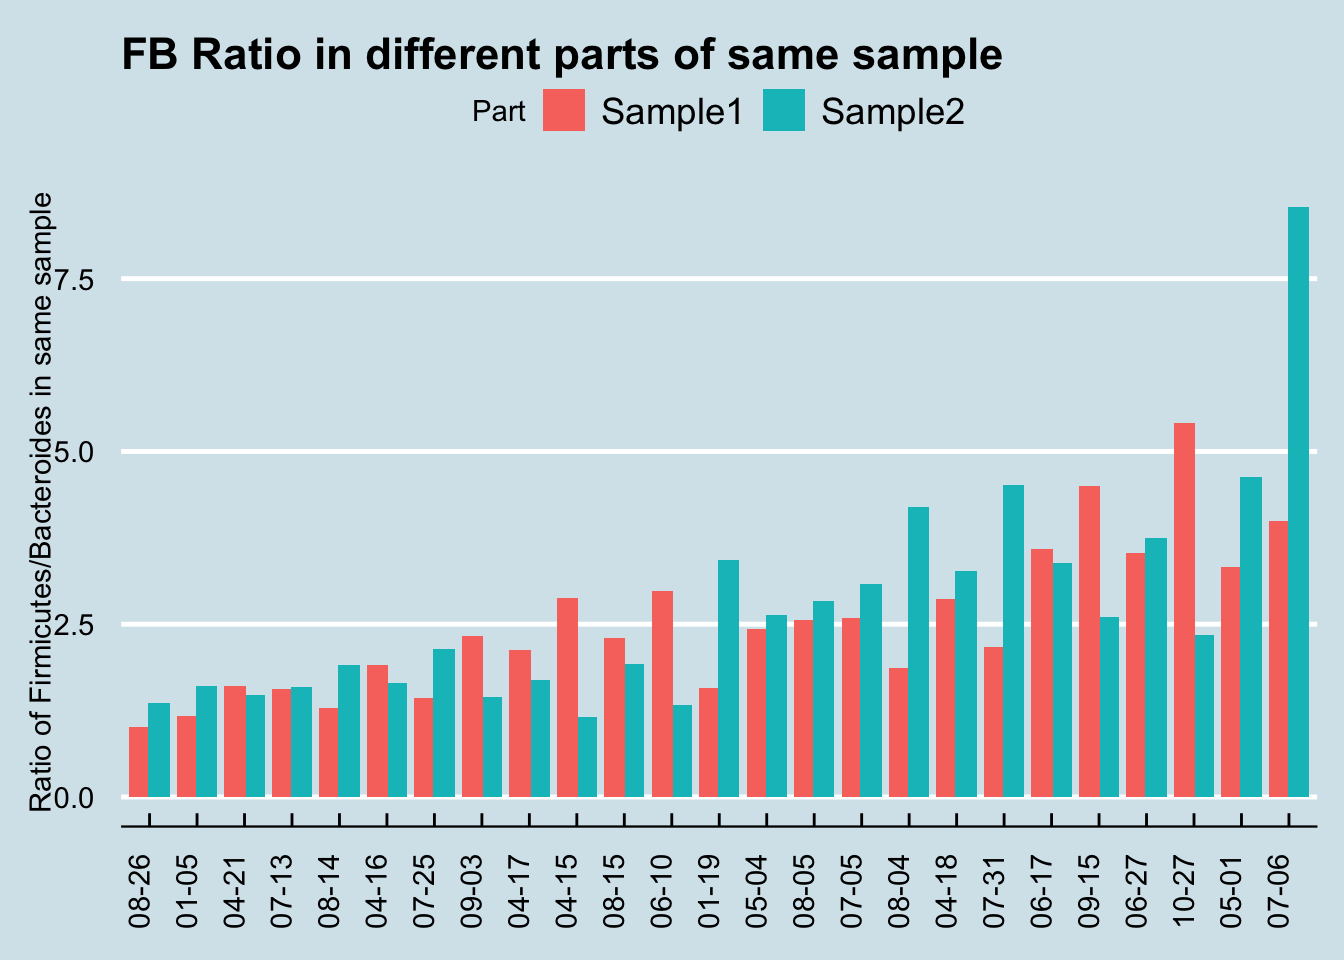
One limitation of the uBiome paper is that they only looked at a tiny subset of all the genus-level taxa found in the sample. Presumably they did this because they’ve previously shown that those particular genera are accurately represented in the sample, but if you want to know if something is evenly distributed, you can’t rely on a subset. For example, even though a subset of my gut phylum, Firmicutes, is reasonably stable all on its own, the ratio of Firmicutes to other important taxa is all over the place.
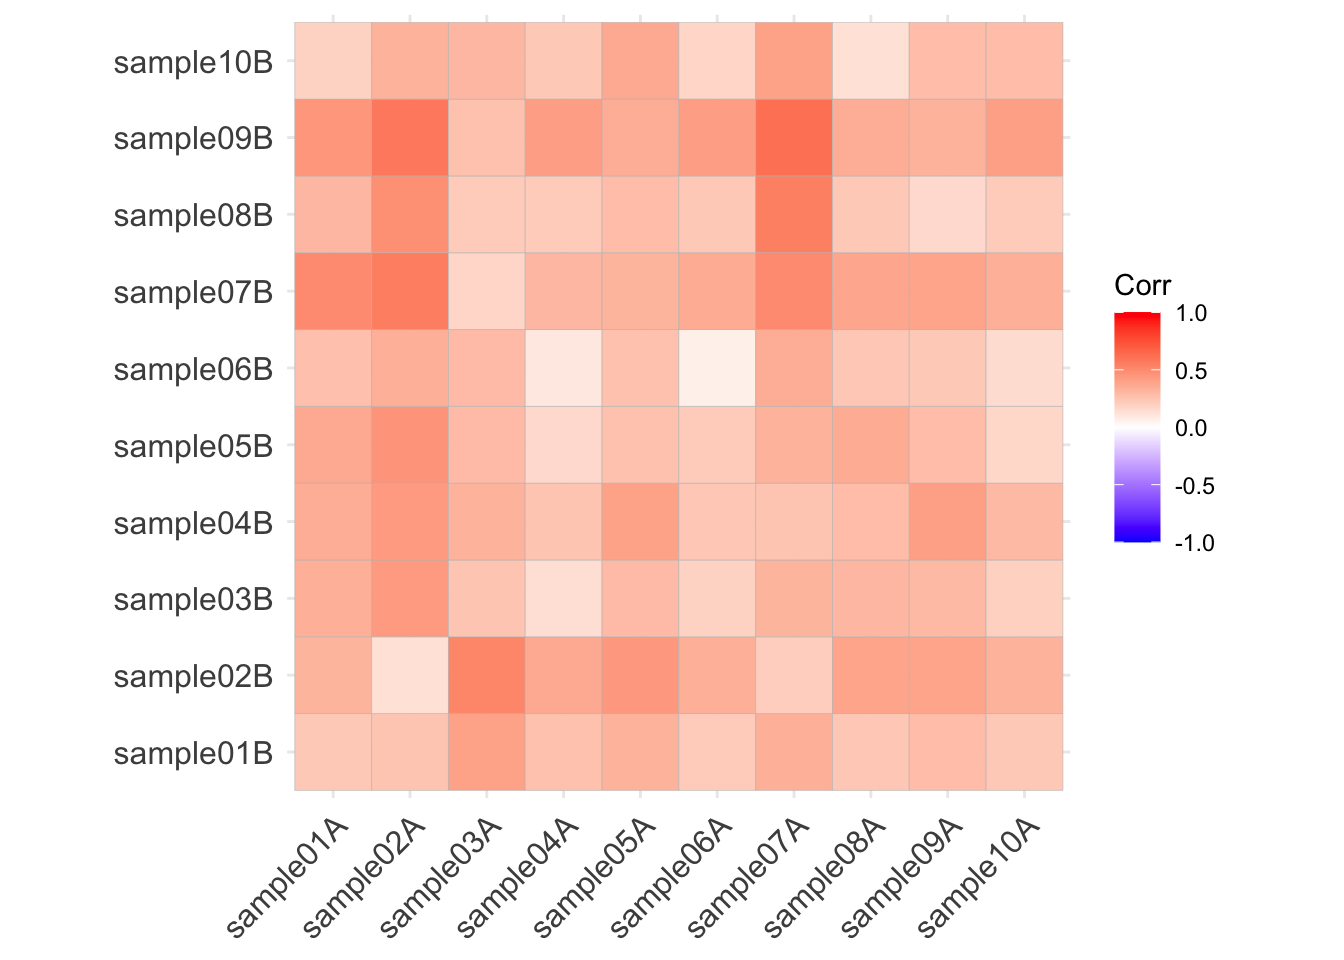
Let’s run the same correlation calculation that uBiome used:
| FB Ratio | Firmicutes | Bacteroidetes |
|---|---|---|
| 0.4 | 0.39 | 0.5 |
At the phylum level, I find much less correlation (at best 0.50) than uBiome did (0.95). What are some possible reasons?
First, as noted they are looking at a subset of 28 taxa that they’ve decided can be most accurately detected using their pipeline. I’m looking only at one phylum. But Firmicutes is the most important, most broadly watched phylum in the gut. If this is measured inaccurately, what does that say about the rest of the experiments?
Second, although I’m studying only a single taxa, they’re using a summary metric of all 28 taxa they measure. The paper doesn’t explain how they summarize 28 microbial abundances into a single number, but I assume they are doing some common similarity metric, like Bray-Curtis. This is a simple and often-used way to tell how similar or different two vectors are from one another. I didn’t do that because I’m comparing a single number, not a vector.
Let’s see if I can make a rough estimate that would be similar to their list of taxa. uBiome’s clinical test tracks 28 microbes at the genus and species level, not all of which can be seen in Explorer.
There are 12 genus-level taxa on both lists (Prevotella, Roseburia, Bifidobacterium, Alistipes, Odoribacter, Barnesiella, Campylobacter, Fusobacterium, Veillonella, Lactobacillus, Peptoclostridium, Salmonella, Ruminococcus)
Here are the correlations between the clinical taxa
| Taxa1 | Taxa2 | Correlation |
|---|---|---|
| Fusobacterium | Prevotella | 0.94 |
| Peptoclostridium | Fusobacterium | 0.67 |
| Peptoclostridium | Prevotella | 0.65 |
| Peptoclostridium | Lactobacillus | 0.64 |
| Barnesiella | Alistipes | 0.61 |
| Veillonella | Fusobacterium | 0.55 |
| Odoribacter | Alistipes | 0.54 |
| Veillonella | Prevotella | 0.52 |
| Barnesiella | Odoribacter | 0.50 |
| Lactobacillus | Prevotella | 0.44 |
Here are the correlations among the Bray-Curtis distances:
(which, upon reflection, means absolutely nothing)
Finally, I think the real difference has to do with sampling technique. I poke the swab all over the place into my samples. My guess is that their experimental subject probably swabbed the outside of the sample at two spots. That may or may not be more realistic than my method – it depends on whether you think toilet paper grabs only the outside or not – but it does highlight the importance of consistency in how you take a sample. If, as the uBiome experiments appear to show, you sample only on the outside, then there is probably a lot of similarity in the same sample. If normal people are more like me, sampling all over the place, then my results show the variability may be much higher than uBiome thinks.