3.13 Diet Change
After a lifetime of enjoying a banana or two almost every day, a microbiome test from DayTwo suggested that I stop eating them. It also said I stop eating most grains, and if I do, to eat them with fat. Generally the recommendations pointed toward me eating a more fat and fewer carbs. So for three months (Dec - Feb) I switched my diet to more of a low carbohydrate high fat (LCHF), with a goal of getting to under 25% carbs and 50% fat. (Figure 3.36)
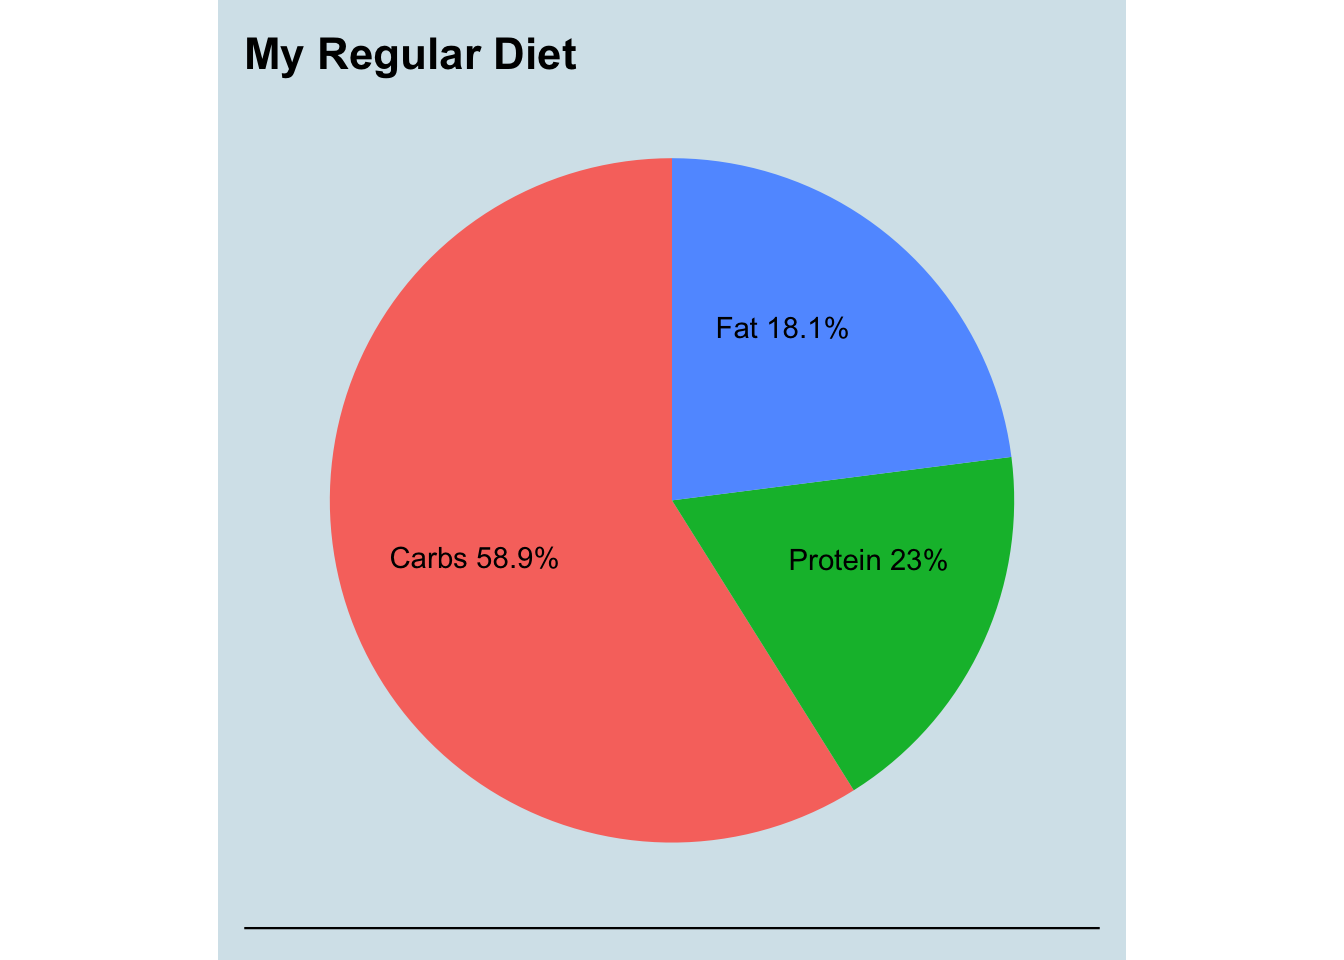
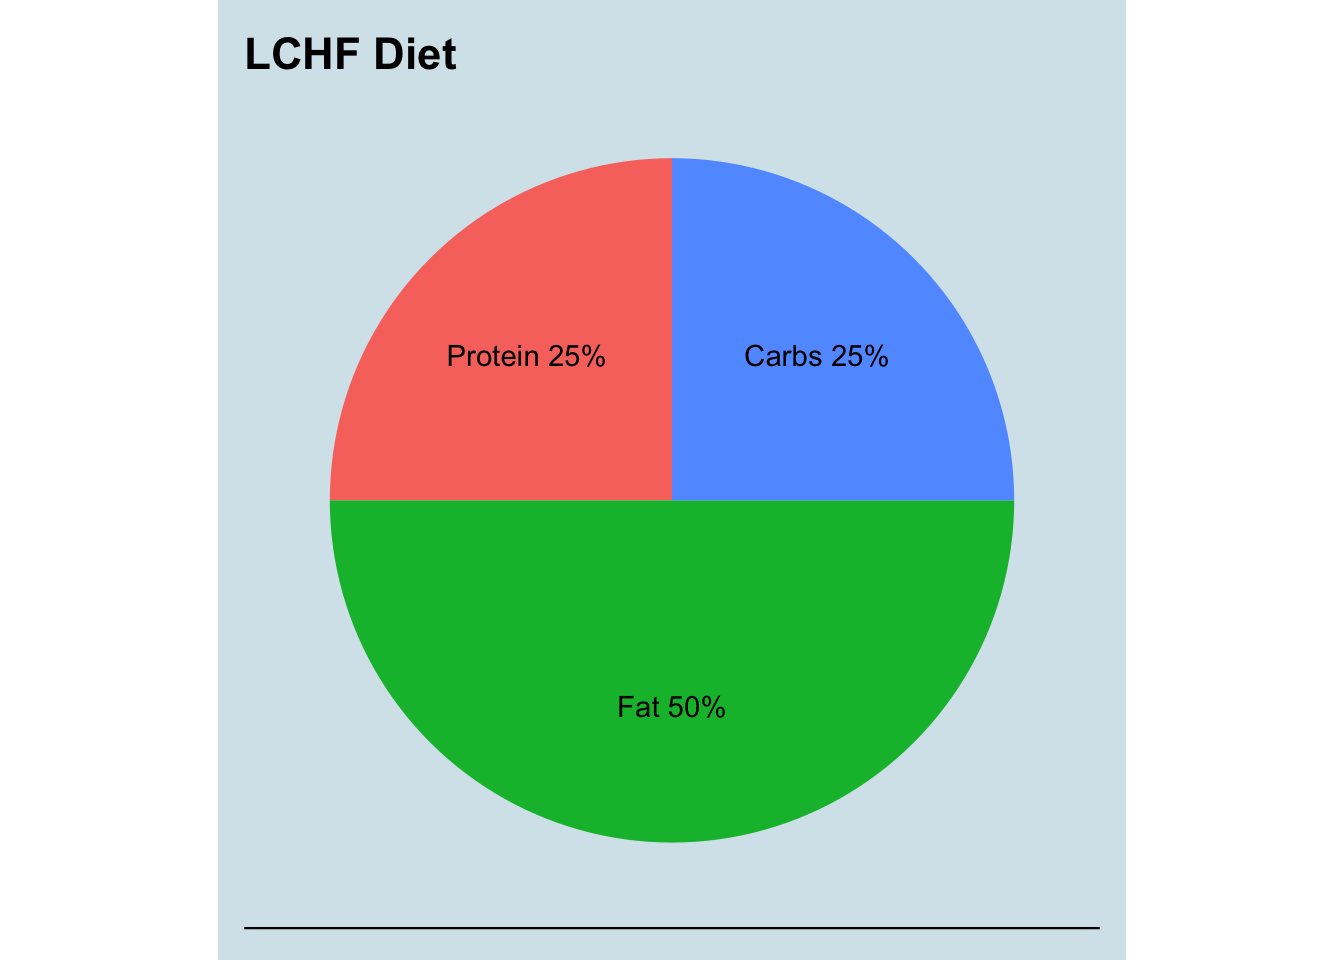
Figure 3.36: Summary of the macro nutrients I ate the year before switching to my Goal diet.
This was harder than it might seem. I think of myself as a typical ominivore on a reasonably-healthy American diet: no sugary drinks or fast food, plenty of vegetables, mostly home-cooked with minimal processing. Sure, I make exceptions now and then, but my generally good health and weight level mean I don’t worry too much about what I eat. I thought skipping bread and rice would be enough, but I learned that carbs are everywhere. To get under 25%, I’m allowed only 65g/day. Just my morning latte is 15g. A single banana is 23g, and if you add one more apple (22g), I’m over my daily limit. You can easily add fat: a tablespoon of olive oil (13g) or a tablespoon of butter (11g) won’t seem like much food, but it adds up quickly. The problem, I found, is that fatty foods also tend to fill me up, so I eat less. And as a percentage of my calories, that means I’m allowed even fewer carbohydrates.
But I persevered. I’m not going to claim I was perfect – I’m doing this experiment for fun, not for serious scientific research – so there were days when I indulged differently. Still, just making a conscious effort was enough to push my eating habits in the general direction of less carbs, more fat. And soon I began to notice some effects.
Three months into the new diet, I noticed my sleep had changed slightly: I seemed to be sleeping longer and feeling better, from an average of 25 minutes extra per night – a 5% improvement. (see Figure 3.37) Could this have a microbiome explanation?
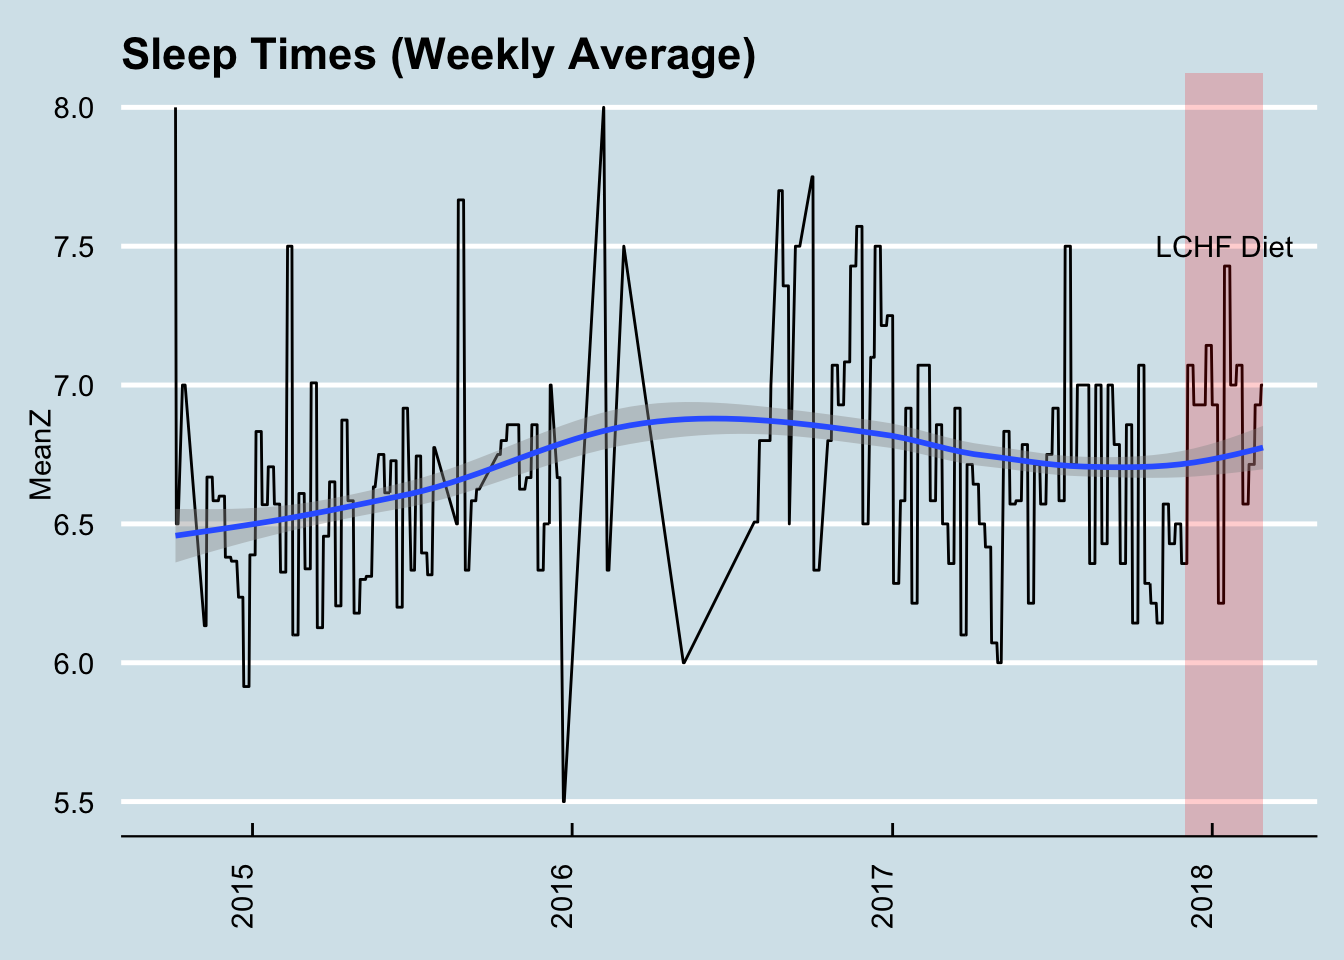
Figure 3.37: My sleep duration apparently increased by about 5% after switching to the new diet.
To find out, I compared four gut microbiome samples taken after starting the new diet with four taken before. (Table 3.3)
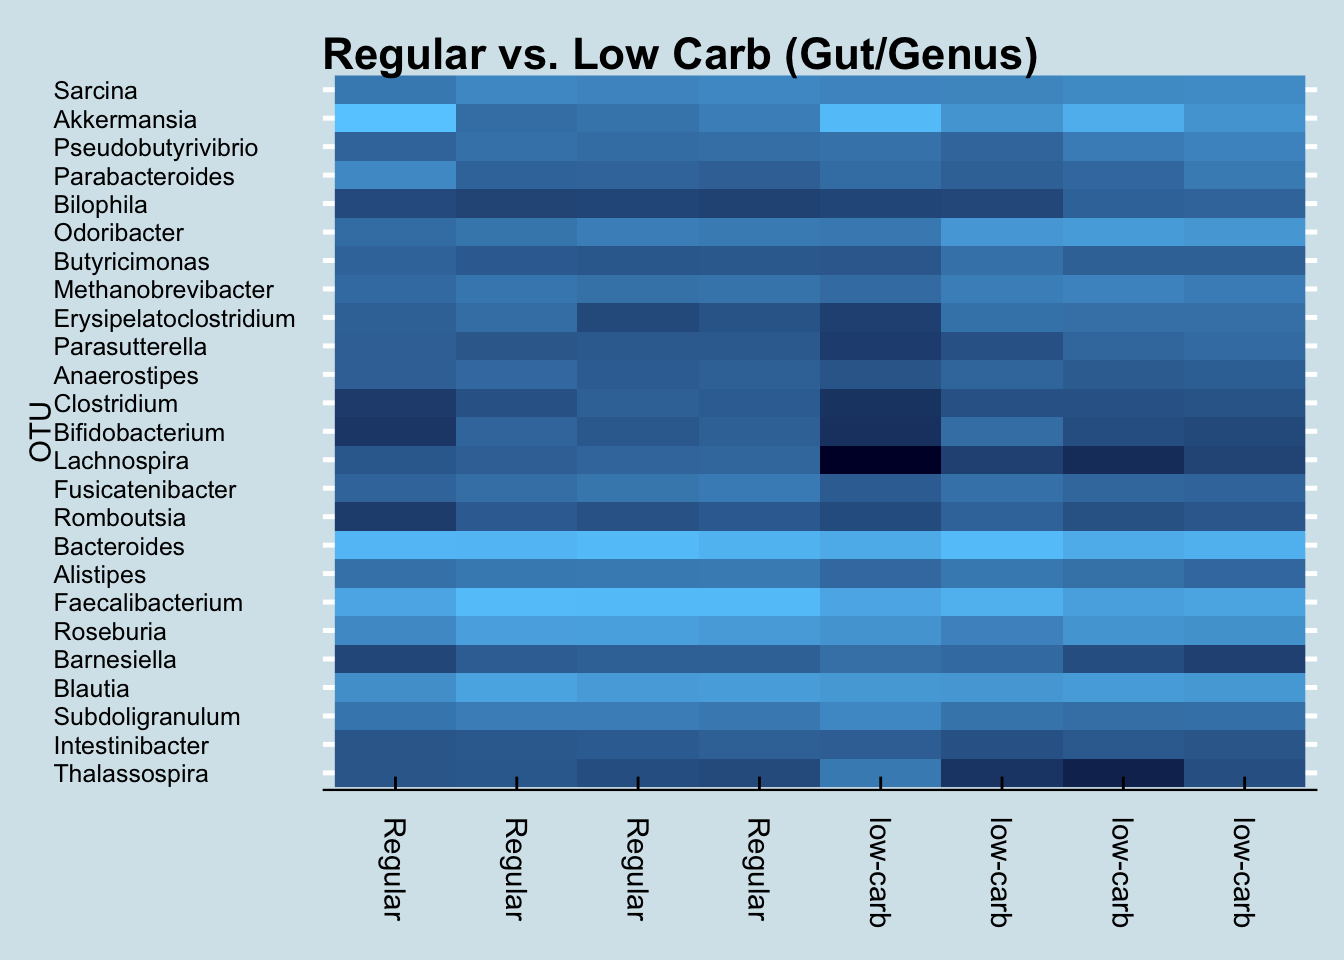
Figure 3.38: Genus level differences before and after a change of diet.
| Regular | Regular | Regular | Regular | LCHF | LCHF | LCHF | LCHF | |
|---|---|---|---|---|---|---|---|---|
| Firmicutes | 43.76 | 67.37 | 62.27 | 64.54 | 52.70 | 51.03 | 51.58 | 52.78 |
| Bacteroidetes | 29.11 | 25.28 | 30.58 | 27.20 | 23.31 | 34.56 | 27.30 | 31.26 |
| Verrucomicrobia | 21.55 | 1.82 | 2.26 | 3.24 | 17.93 | 6.94 | 13.05 | 7.17 |
| Proteobacteria | 4.10 | 2.76 | 2.72 | 2.50 | 4.15 | 3.00 | 4.08 | 4.77 |
| Euryarchaeota | 1.76 | 2.51 | 2.14 | 2.39 | 1.80 | 3.35 | 3.76 | 3.00 |
Note the substantial difference in the level of Firmicutes (Table 3.3). All of the LCHF samples seem to have Firmicutes just slightly over 50%, whereas three of the four “Regular” samples are much higher. Is that a coincidence? Is it statistically significant?
To find out, I looked at all my gut samples from the previous six months, when I was on my “regular” diet, a total of 72 samples. The average (mean) abundance of Firmicutes in those samples is shown in Table 3.4, plus the output of a simple T-Test that shows the likelihood that the difference could be due to chance alone.
| Regular (Ave) | LCHS |
|---|---|
| 60.21 | 52.02 |
##
##  Welch Two Sample t-test
##
## data:  f$abundance and ff$abundance
## t = 6.4034, df = 65.885, p-value = 0.00000001848
## alternative hypothesis: true difference in means is not equal to 0
## 95 percent confidence interval:
##   56344.51 107402.49
## sample estimates:
## mean of x mean of y
##  602076.0  520202.5
The extremely low p-value (0) implies that the difference in sleep is unlikely to be due to chance. P-values have serious problems as a way to measure whether something is statistically significant, but as a sniff-test, in this case the value is so low that it’s worth investigating further.
Incidentally, among those Regular samples there were a few with under 50% Firmicutes abundance, but were easily explained: for example, three of them happened after my Soylent experiment.
Conclusion: A low-carb high fat diet can affect Firmicutes abundance.
What about after my diet. Did things bounce back to normal? Although I’m more conscious of what I eat, and do generally try to eat fewer carbs (e.g. I’ve stopped all banana eating), I wouldn’t say I keep to the diet as rigorously as I did. But here are the results from the tests I took after finishing the experiment:
| 2018-02-11 | 2018-02-12 | 2018-02-16 | 2018-02-20 | 2018-02-26 | 2018-03-15 | 2018-03-25 | 2018-03-29 | 2018-04-02 | 2018-04-03 | 2018-04-10 | 2018-04-17 | 2018-05-10 | 2018-09-18 | 2018-11-14 | 2018-12-10 | 2019-02-18 | 2019-03-24 | 2019-05-01 | 2019-05-28 | 2019-05-29 | |
|---|---|---|---|---|---|---|---|---|---|---|---|---|---|---|---|---|---|---|---|---|---|
| Firmicutes | 51.58 | 52.78 | 55.32 | 55.66 | 58.80 | 58.47 | 49.91 | 35.29 | 43.69 | 60.06 | 63.29 | 42.10 | 51.72 | 56.24 | 54.51 | 49.66 | 32.56 | 50.63 | 34.79 | 48.60 | 54.07 |
| Bacteroidetes | 27.30 | 31.26 | 22.50 | 32.96 | 33.44 | 30.31 | 26.44 | 26.83 | 30.79 | 24.85 | 25.83 | 35.76 | 24.63 | 25.75 | 25.03 | 26.09 | 34.20 | 32.70 | 26.42 | 27.88 | 28.19 |
| Verrucomicrobia | 13.05 | 7.17 | 14.02 | 4.41 | 2.31 | 2.54 | 16.18 | 23.09 | 19.95 | 10.56 | 4.50 | 18.14 | 18.38 | 11.94 | 13.84 | 18.03 | 20.73 | 8.27 | 30.23 | 16.85 | 13.49 |
| Proteobacteria | 4.08 | 4.77 | 3.78 | 4.74 | 3.56 | 5.93 | 3.67 | 13.33 | 2.58 | 2.64 | 3.54 | 1.50 | 1.13 | 2.49 | 2.30 | 3.33 | 11.40 | 3.55 | 5.03 | 3.82 | 2.15 |
| Euryarchaeota | 3.76 | 3.00 | 3.77 | 1.98 | 0.33 | 1.76 | 3.15 | 2.15 | 1.30 | 4.13 | 5.68 | 3.10 | 2.28 | 3.12 | 4.02 | 2.59 | 1.42 | 5.64 | 4.34 | 2.24 | 3.49 |
| Actinobacteria | 1.95 | 1.82 | 1.43 | 1.07 | 1.18 | 1.96 | 2.96 | 0.78 | 1.92 | 1.27 | 1.85 | 2.02 | 3.84 | 2.94 | 3.46 | 2.30 | 0.80 | 4.23 | 1.91 | 2.25 | 1.64 |
| Synergistetes | 1.10 | 1.27 | 1.90 | 0.33 | 0.40 | 0.27 | 0.67 | 0.50 | 0.69 | 0.31 | 0.40 | 0.43 | 0.22 | 0.39 | 0.74 | 0.53 | 0.21 | 0.33 | 1.49 | 0.42 | 0.30 |
| Lentisphaerae | 0.78 | 0.88 | 0.92 | 0.55 | 0.31 | 0.40 | 0.13 | 0.12 | 0.36 | 0.32 | 0.52 | 0.05 | 0.08 | 0.23 | 0.11 | 0.05 | 0.08 | 0.26 | 0.10 | 0.17 | 0.16 |
| Tenericutes | 0.15 | 0.04 | 0.12 | 0.25 | 0.00 | 0.11 | 0.03 | 0.06 | 0.00 | 0.00 | 0.06 | 0.00 | 0.00 | 0.01 | 0.00 | 0.00 | 0.02 | 0.02 | 0.01 | 0.01 | 0.01 |
| Fibrobacteres | 0.00 | 0.00 | 0.00 | 0.02 | 0.00 | 0.00 | 0.00 | 0.00 | 0.01 | 0.00 | 0.02 | 0.00 | 0.00 | 0.00 | 0.01 | 0.00 | 0.00 | 0.01 | 0.00 | 0.00 | 0.00 |