4.8 Gut Issues
NOTE: THIS CHAPTER IS AN EARLY DRAFT
Probably the most common reason people are motivated to study their microbiome is gut dysbiosis. The word “dysbiosis” is as good a diagnosis as any for a problem that is often frustratingly difficult to pin down.
Ten years ago, CT was in excellent health, active in sports with a lean, muscular build. But after a trip to China, and a bout of what he thought was food poisoning, he hasn’t been the same. Food allergies, sensitivities to chemicals and bright lights, fatigue, and unexplained muscular problems. Doctors were baffled. Nothing seemed to help, and it looked like he might simply have to accept that this was the new way he’d have to live.
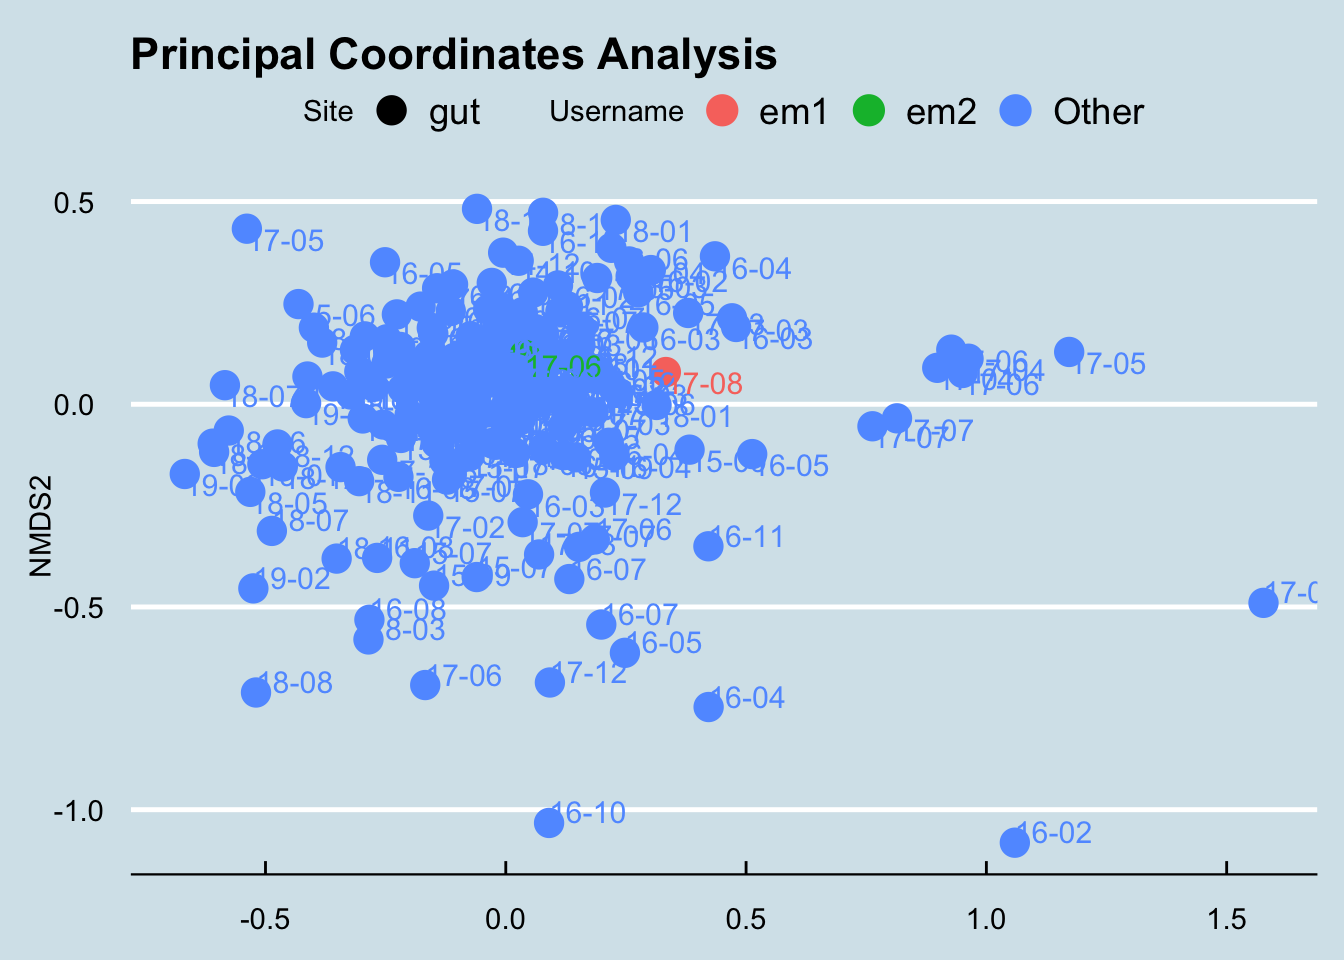
The first thing to note is that CT’s samples are pretty similar in overall diversity to the healthy samples in our database. (Figure 4.10)
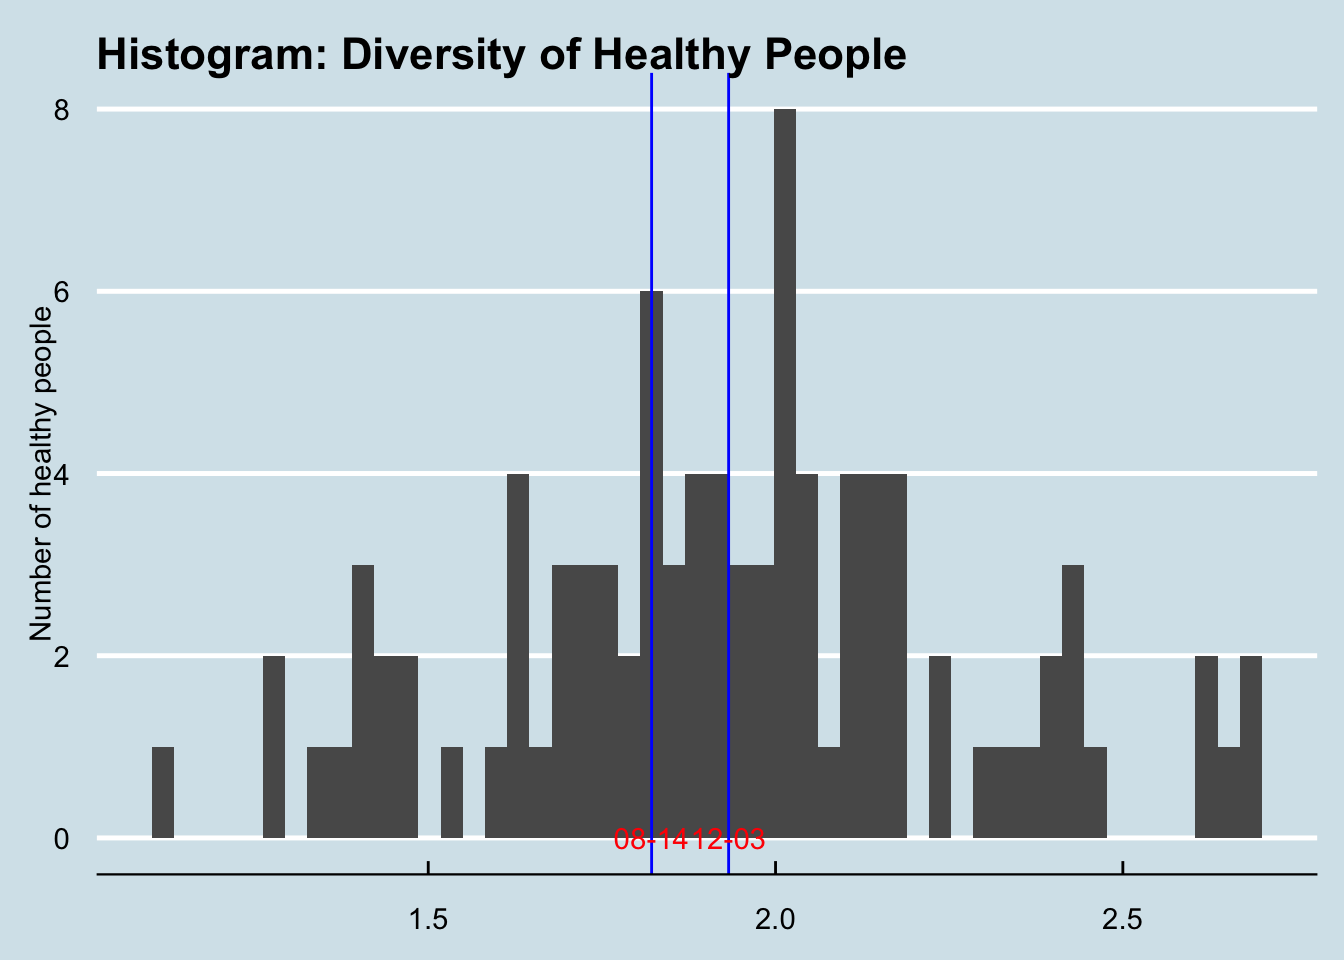
Figure 4.10: The blue lines are CT’s samples.
So what might be driving CT’s issues?
Let’s look at the microbes that are significantly different in CT than in our database of healthy people. The genus-level microbes listed in Figure ?? are outliers.
| taxa | max | min | median | mean | sd | original | |
|---|---|---|---|---|---|---|---|
| Haemophilus | Haemophilus | 0.396 | 0 | 0 | 0.030 | 0.072 | 1.739 |
| Parvibacter | Parvibacter | 0.037 | 0 | 0 | 0.003 | 0.007 | 0.039 |
From this it appears CT has far higher Haemophilus than the healthy people. What might that mean?
Can we find other people with similar high levels? Here’s a look at the top 10 most abundant samples in our database. Note that all are unhealthy.
| Condition | Abundance | |
|---|---|---|
| 89706 | Dysbiosis | 6.0841 |
| 109531 | Dysbiosis | 3.3989 |
| 906356 | Dysbiosis | 1.7394 |
| 911397 | Cancer | 1.2119 |
| 379847 | Dysbiosis | 1.1825 |
| 1168330 | Dysbiosis | 1.1379 |
| 55215 | NA | 0.8869 |
| 30563 | Dysbiosis | 0.6256 |
| 108135 | NA | 0.6032 |
| 876277 | Cancer | 0.5932 |
4.8.1 CB
CB is a health-conscious woman who has long suffered from gut issues.
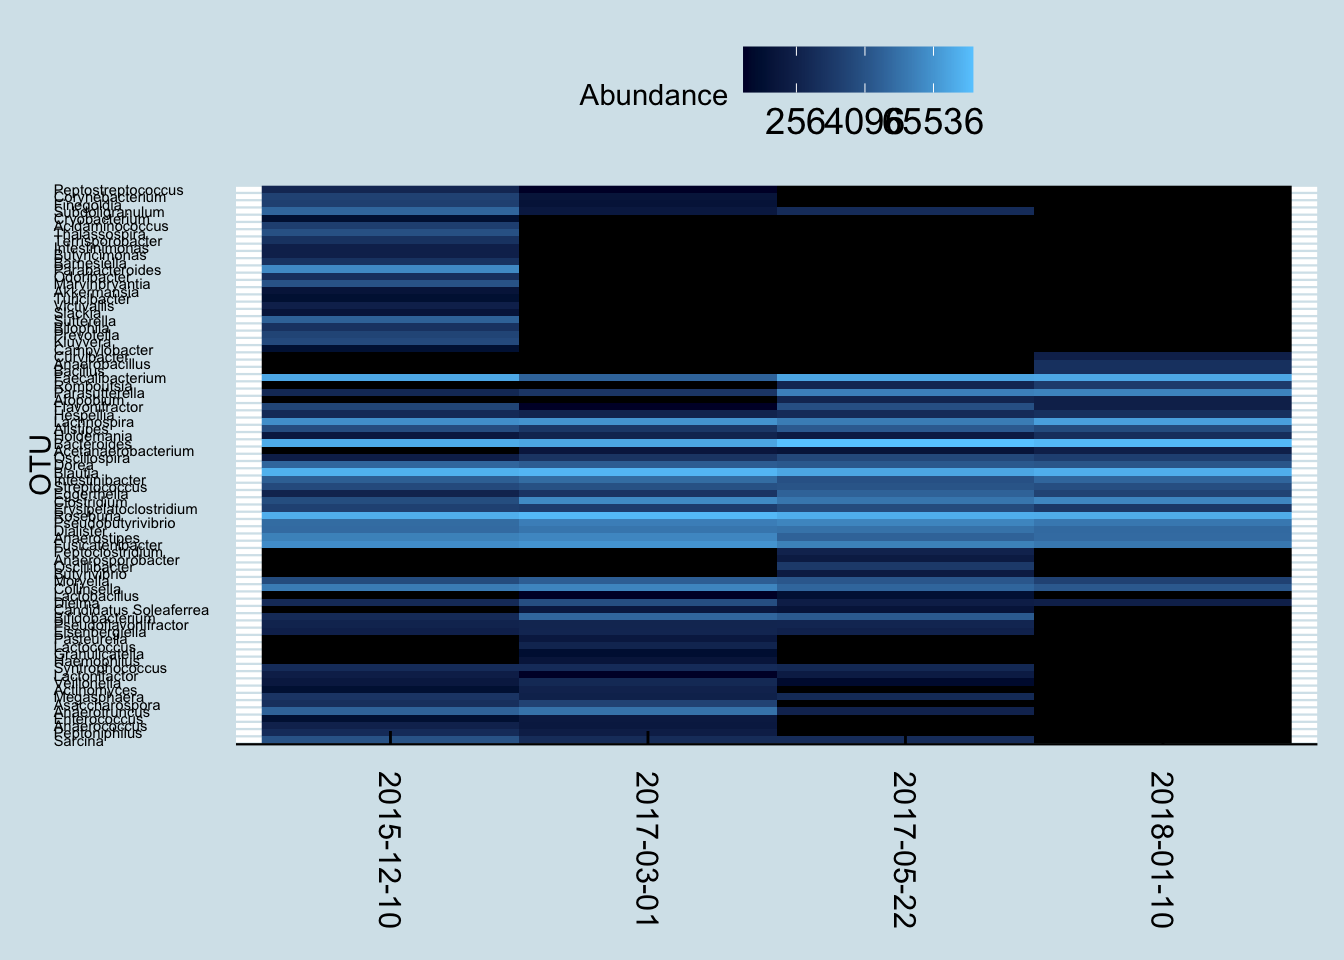
Let’s start with a heatmap of all her gut samples to see if we can spot any patterns
| taxa | max | min | median | mean | sd | original | |
|---|---|---|---|---|---|---|---|
| Clostridium | Clostridium | 2.770 | 0 | 0.644 | 0.828 | 0.564 | 4.462 |
| Lachnospira | Lachnospira | 7.017 | 0 | 0.553 | 1.076 | 1.313 | 10.101 |
| Eggerthella | Eggerthella | 0.269 | 0 | 0.006 | 0.028 | 0.050 | 0.841 |
| Dielma | Dielma | 0.102 | 0 | 0.000 | 0.005 | 0.013 | 0.330 |
| Syntrophococcus | Syntrophococcus | 0.038 | 0 | 0.000 | 0.001 | 0.006 | 0.050 |
| Acetanaerobacterium | Acetanaerobacterium | 0.005 | 0 | 0.000 | 0.000 | 0.001 | 0.023 |
| Curvibacter | Curvibacter | 0.000 | 0 | 0.000 | 0.000 | 0.000 | 0.023 |
4.8.2 NJ1
Hard to tell from this single case. How about if we look at another person (“NJ1”)
Here are all the outliers in NJ1’s samples:
## [1] "before ACHIM"
##
##
## Table: (\#tab:caseStudyGutNJ1Outliers)NJ1 Outliers 664303
##
## |              |taxa          |   max|   min| median|  mean|    sd| original|
## |:-------------|:-------------|-----:|-----:|------:|-----:|-----:|--------:|
## |Lachnospira   |Lachnospira   | 7.017| 0.000|  0.553| 1.076| 1.313|   10.010|
## |Holdemania    |Holdemania    | 0.070| 0.000|  0.006| 0.008| 0.011|    0.121|
## |Collinsella   |Collinsella   | 6.515| 0.005|  1.321| 1.751| 1.333|    7.146|
## |Catabacter    |Catabacter    | 0.012| 0.000|  0.000| 0.001| 0.002|    0.015|
## |Acetatifactor |Acetatifactor | 0.000| 0.000|  0.000| 0.000| 0.000|    0.002|
##
## [1] "High amonia"
##
##
## Table: (\#tab:caseStudyGutNJ1Outliers)NJ1 Outliers 153887
##
## |              |taxa          |   max| min| median|  mean|    sd| original|
## |:-------------|:-------------|-----:|---:|------:|-----:|-----:|--------:|
## |Butyrivibrio  |Butyrivibrio  | 6.165|   0|  0.000| 0.216| 0.793|    8.424|
## |Oscillibacter |Oscillibacter | 0.499|   0|  0.017| 0.078| 0.120|    0.666|
## |Fibrobacter   |Fibrobacter   | 0.072|   0|  0.000| 0.005| 0.015|    0.437|
##
## [1] "porphyria"
##
##
## Table: (\#tab:caseStudyGutNJ1Outliers)NJ1 Outliers 174763
##
## |            |taxa        |   max|   min| median|  mean|    sd| original|
## |:-----------|:-----------|-----:|-----:|------:|-----:|-----:|--------:|
## |Megasphaera |Megasphaera | 2.235| 0.000|  0.001| 0.106| 0.354|    4.894|
## |Collinsella |Collinsella | 6.515| 0.005|  1.321| 1.751| 1.333|    8.178|
When I look closer, it appears that much of the difference is driven by one genus, Colinsella, of which she has among the highest abundances I’ve seen. In my own gut samples, I’ve never had more than 5% of that genus, but she has more than 8%. Is that good or bad? Who knows? But it’s something I would spend more time studying.
Clearly different at nearly all taxa. Here are the microbes that went extinct in the second sample:
## Acetanaerobacterium, Acetatifactor, Anaerococcus, Atopobium, Campylobacter, Candidatus Stoquefichus, Christensenella, Cloacibacillus, Clostridioides, Coprobacter, Corynebacterium, Dialister, Dielma, Eggerthella, Eisenbergiella, Enterobacter, Fastidiosipila, Finegoldia, Fusobacterium, Gordonibacter, Megasphaera, Mobiluncus, Paraprevotella, Parvimonas, Peptoniphilus, Porphyromonas, Prevotella, Pseudoflavonifractor, Romboutsia, Solobacterium, Staphylococcus, Succiniclasticum, Thalassospira, Varibaculumand vice versa:
## Acetitomaculum, Anaerosporobacter, Asaccharospora, Butyrivibrio, Delftia,
## Enterorhabdus, Fibrobacter, Howardella, Marvinbryantia, Methanobrevibacter,
## Pasteurella, Peptococcus, Sporobacter
4.8.3 Ed
Let’s look at another case: “Ed” is a German man on a mostly vegetarian diet.
| taxa | max | min | median | mean | sd | original |
|---|
4.8.4 Celiac Patients
L and her friend S suffer from the gluten disorder called Celiac disease.
## 2017-08-08 2017-06-26
## Firmicutes 53.3713 45.5525
## Bacteroidetes 31.9602 51.0501
## Verrucomicrobia 4.7563 0.1230
## Proteobacteria 4.5754 1.7504
## Actinobacteria 2.7873 1.4615
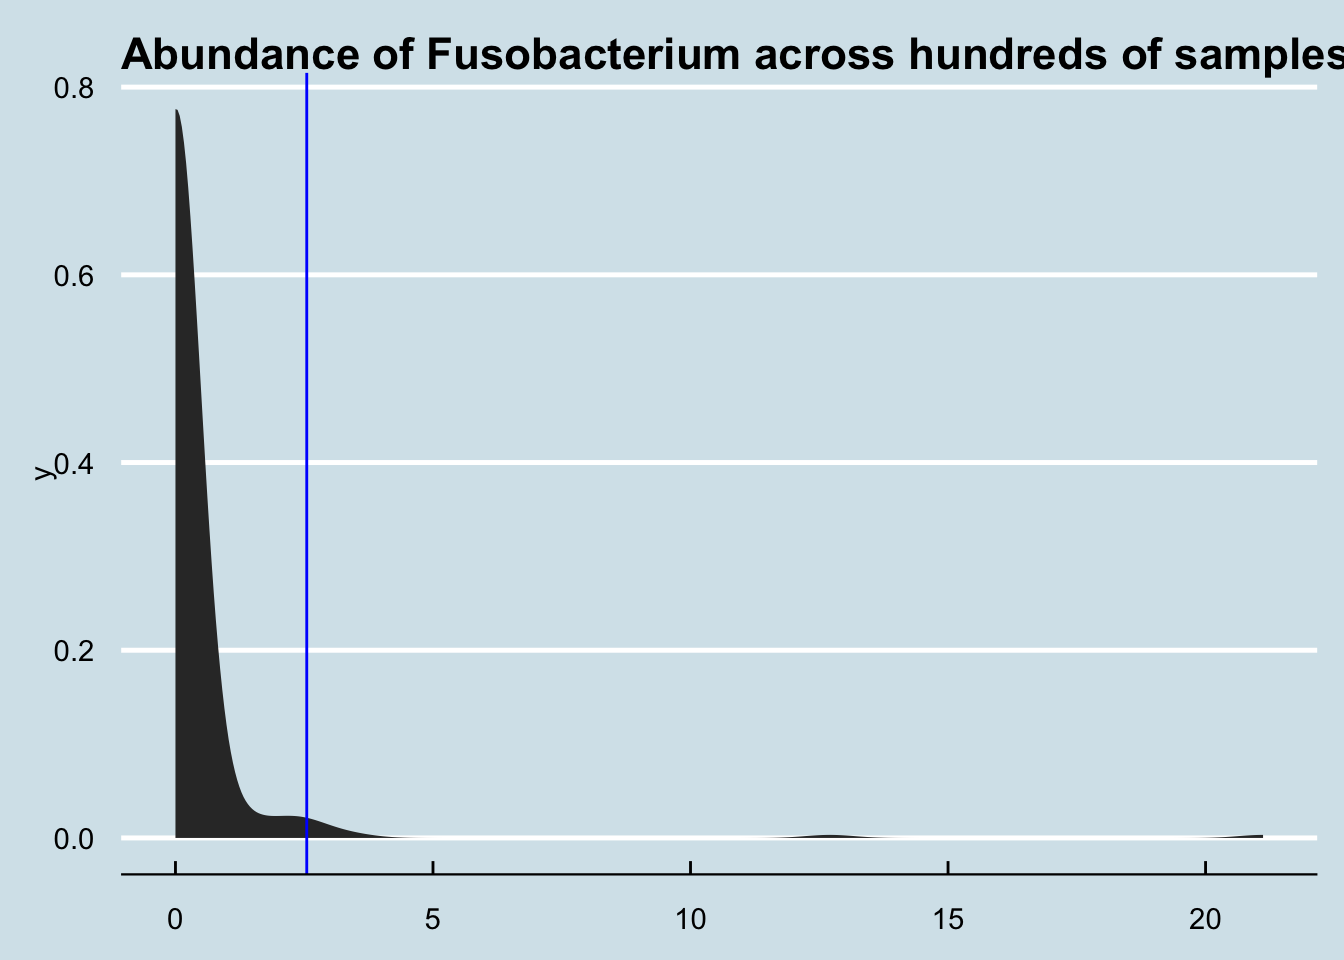
## Fusobacteria 2.5491 0.0025## 2017-08-08 2017-06-26
## Bacteroides 27.7946 38.0893
## Blautia 27.3715 6.1286
## Akkermansia 4.7563 0.1230
## Klebsiella 4.5355 0.0466
## Moryella 3.1931 0.1995
## Roseburia 2.9123 6.4227
## Pseudobutyrivibrio 2.7101 2.4747
## Parabacteroides 2.6289 2.3931
## Faecalibacterium 1.3490 11.4020
## Barnesiella 0.0000 6.0560I don’t often see L’s level of Fusobacterium. A quick check, though, shows that she’s not the highest.
4.8.5 SJ
His doctor says he has high Klebsiella, but how high is high?
Here are the genus-level microbes that are out of range:
| taxa | max | min | median | mean | sd | original | |
|---|---|---|---|---|---|---|---|
| Adlercreutzia | Adlercreutzia | 0.371 | 0 | 0.031 | 0.07 | 0.088 | 0.374 |
and species:
| taxa | max | min | median | mean | sd | original | |
|---|---|---|---|---|---|---|---|
| Adlercreutzia equolifaciens | Adlercreutzia equolifaciens | 0.371 | 0 | 0.031 | 0.068 | 0.084 | 0.374 |
| Dialister sp. E2_20 | Dialister sp. E2_20 | 0.649 | 0 | 0.000 | 0.016 | 0.094 | 3.556 |
| Bacteroides clarus | Bacteroides clarus | 0.426 | 0 | 0.000 | 0.019 | 0.068 | 0.822 |
| Propionibacterium acnes | Propionibacterium acnes | 0.000 | 0 | 0.000 | 0.000 | 0.000 | 0.008 |
| Barnesiella sp. 177 | Barnesiella sp. 177 | 0.050 | 0 | 0.000 | 0.001 | 0.007 | 0.181 |
4.8.6 U5
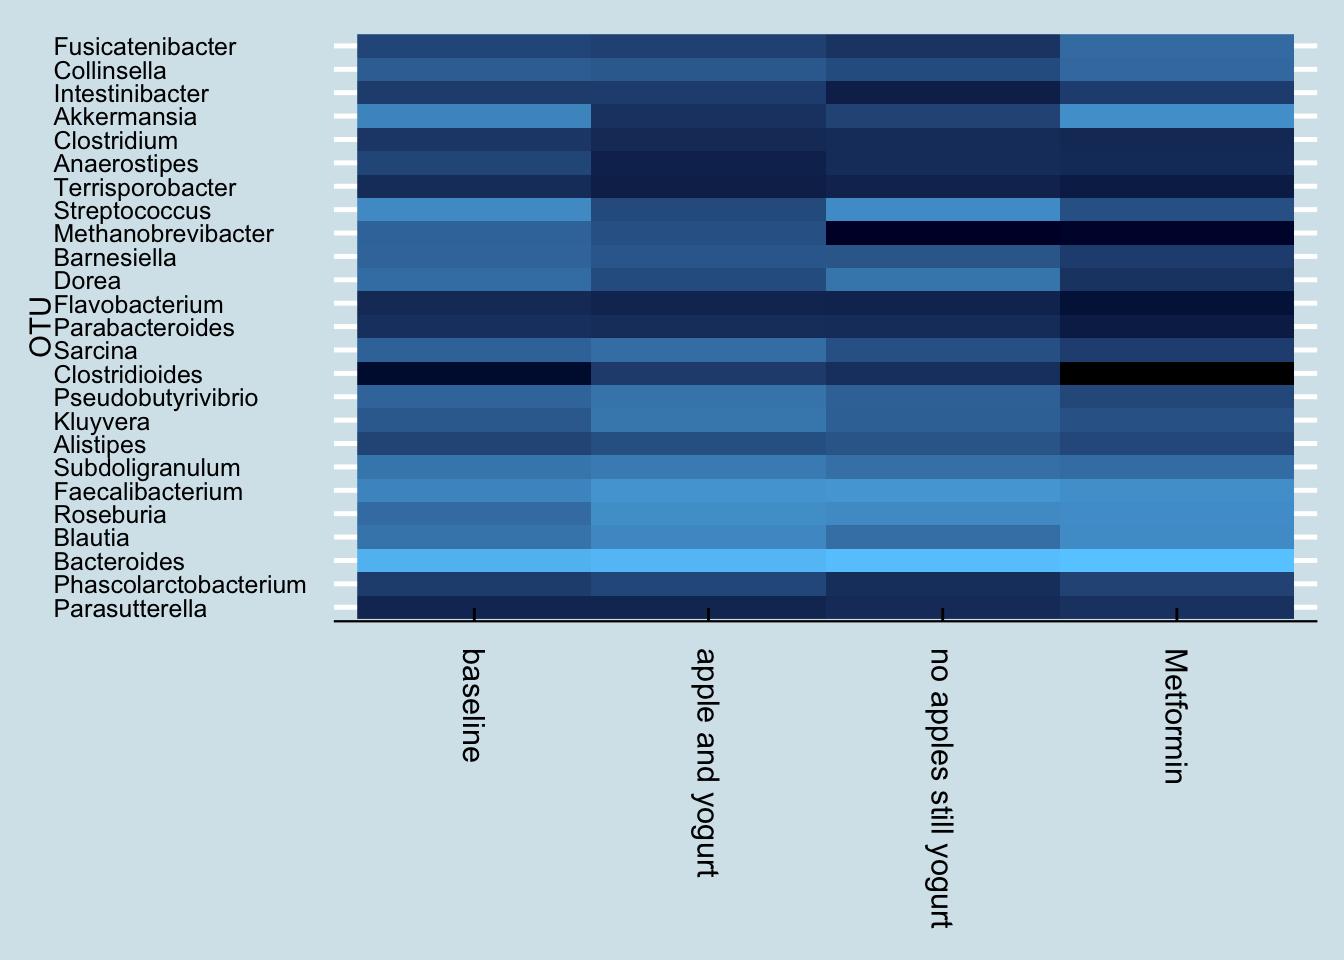
Another user was recently diagnosed as pre-diabetic and began taking Metformin.
His microbial abundance seems to be in range of healthy people at both genus and species levels.
Interestingly, he had tried a few experiments before going on Metformin: eating an apple daily with yogurt, followed by daily yogurt alone. Here are the results:
4.8.7 Mr. C
Here’s another person. Let’s see which parts of their sample are outliers compared to healthy people.
| taxa | max | min | median | mean | sd | original | |
|---|---|---|---|---|---|---|---|
| Oscillospira | Oscillospira | 0.660 | 0 | 0.025 | 0.063 | 0.119 | 0.906 |
| Shuttleworthia | Shuttleworthia | 0.096 | 0 | 0.000 | 0.007 | 0.017 | 0.430 |
4.8.8 FF
Here’s a person from Norway who has long suffered from IBS. Let’s look at outliers:
| taxa | max | min | median | mean | sd | original | |
|---|---|---|---|---|---|---|---|
| Actinobacillus | Actinobacillus | 0.045 | 0 | 0 | 0.001 | 0.006 | 0.100 |
| Haemophilus | Haemophilus | 0.396 | 0 | 0 | 0.030 | 0.072 | 1.183 |
| Aggregatibacter | Aggregatibacter | 0.029 | 0 | 0 | 0.001 | 0.004 | 0.030 |
| Leptotrichia | Leptotrichia | 0.008 | 0 | 0 | 0.000 | 0.001 | 0.011 |
4.8.9 High Proteobacteria
Usually I associate the phylum Proteobacteria with trouble. So when recently somebody showed me results with nearly 10%, I immediately wanted to know more.
| db1 % | |
|---|---|
| Bacteroides | 22.0727 |
| Blautia | 11.0547 |
| Faecalibacterium | 10.4940 |
| Parasutterella | 7.0378 |
| Alistipes | 5.7292 |
| Subdoligranulum | 5.3179 |
| Roseburia | 3.2436 |
| Pseudobutyrivibrio | 2.6146 |
| Lachnospira | 2.1729 |
| Barnesiella | 2.0692 |
| Desulfovibrio | 1.5667 |
| Sarcina | 1.4895 |
| Phascolarctobacterium | 1.4516 |
| Butyricimonas | 1.2098 |
| Parabacteroides | 1.1428 |
| Collinsella | 1.1149 |
| Anaerostipes | 1.0111 |
| Fusicatenibacter | 0.8251 |
| Dorea | 0.7935 |
| Kluyvera | 0.7099 |
| Clostridium | 0.4049 |
| Bilophila | 0.3986 |
| Flavobacterium | 0.3189 |
| Terrisporobacter | 0.3125 |
| Odoribacter | 0.2771 |
Most of the Proteobacteria is from the genus Parasutterella. I’m not sure what this one does, but the levels in this sample are much higher than anything I’ve seen before.