9.2 Healthy ranges
Our collection of 94 samples we have determined are from healthy people shows the following ranges for the top 20 genera (Figure 9.1)
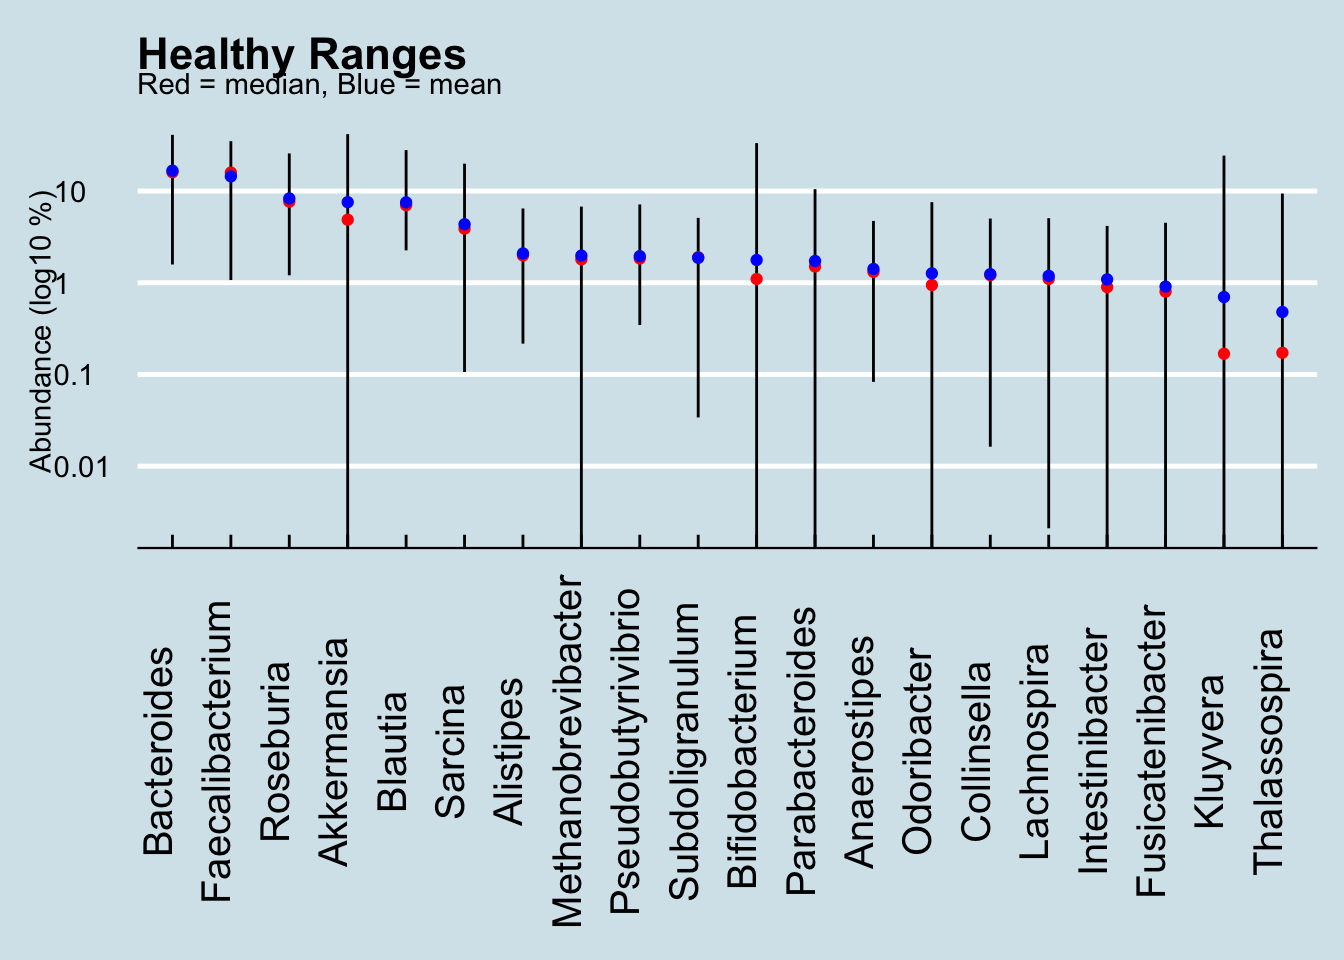
Figure 9.1: Vertical lines show the abundance ranges found in healthy people (log scale).
A complete list of all species ever found in my gut is in the supplemental materials.
Can I learn anything special about differences between healthy and unhealthy people? Let’s look at outliers (Table 9.1). This table shows the typical ranges found in healthy people, plus a column showing the level found in unhealthy people.
| taxa | max | min | median | mean | sd | Unhealthy | |
|---|---|---|---|---|---|---|---|
| Acetanaerobacterium | Acetanaerobacterium | 0.005 | 0.000 | 0.000 | 0.000 | 0.001 | 0.023 |
| Acetatifactor | Acetatifactor | 0.000 | 0.000 | 0.000 | 0.000 | 0.000 | 0.002 |
| Acidaminococcus | Acidaminococcus | 0.652 | 0.000 | 0.000 | 0.013 | 0.072 | 3.612 |
| Actinobacillus | Actinobacillus | 0.045 | 0.000 | 0.000 | 0.001 | 0.006 | 0.491 |
| Actinotignum | Actinotignum | 0.000 | 0.000 | 0.000 | 0.000 | 0.000 | 0.003 |
| Adlercreutzia | Adlercreutzia | 0.371 | 0.000 | 0.031 | 0.070 | 0.088 | 0.600 |
| Aggregatibacter | Aggregatibacter | 0.029 | 0.000 | 0.000 | 0.001 | 0.004 | 0.057 |
| Alloprevotella | Alloprevotella | 7.902 | 0.000 | 0.000 | 0.131 | 0.855 | 15.857 |
| Anaerobacter | Anaerobacter | 0.109 | 0.000 | 0.000 | 0.001 | 0.011 | 0.115 |
| Anaerofilum | Anaerofilum | 0.024 | 0.000 | 0.000 | 0.002 | 0.005 | 0.038 |
| Anaeroglobus | Anaeroglobus | 0.010 | 0.000 | 0.000 | 0.000 | 0.001 | 0.022 |
| Anaerovorax | Anaerovorax | 0.054 | 0.000 | 0.000 | 0.002 | 0.008 | 0.078 |
| Aquabacterium | Aquabacterium | 0.004 | 0.000 | 0.000 | 0.000 | 0.000 | 0.005 |
| Arcanobacterium | Arcanobacterium | 0.008 | 0.000 | 0.000 | 0.000 | 0.001 | 0.026 |
| Bacteroides | Bacteroides | 53.846 | 0.367 | 18.363 | 20.197 | 12.375 | 75.396 |
| Bradyrhizobium | Bradyrhizobium | 0.005 | 0.000 | 0.000 | 0.000 | 0.001 | 0.053 |
| Butyricicoccus | Butyricicoccus | 0.191 | 0.000 | 0.000 | 0.005 | 0.025 | 0.270 |
| Butyrivibrio | Butyrivibrio | 6.165 | 0.000 | 0.000 | 0.216 | 0.793 | 8.424 |
| Candidatus Soleaferrea | Candidatus Soleaferrea | 0.074 | 0.000 | 0.003 | 0.006 | 0.010 | 0.093 |
| Candidatus Stoquefichus | Candidatus Stoquefichus | 0.054 | 0.000 | 0.000 | 0.003 | 0.010 | 0.261 |
| Catabacter | Catabacter | 0.012 | 0.000 | 0.000 | 0.001 | 0.002 | 0.017 |
| Christensenella | Christensenella | 0.004 | 0.000 | 0.000 | 0.000 | 0.001 | 0.005 |
| Citrobacter | Citrobacter | 0.075 | 0.000 | 0.000 | 0.002 | 0.010 | 0.145 |
| Clostridium | Clostridium | 2.770 | 0.000 | 0.644 | 0.828 | 0.564 | 5.810 |
| Collinsella | Collinsella | 6.515 | 0.005 | 1.321 | 1.751 | 1.333 | 8.178 |
| Coprobacillus | Coprobacillus | 0.012 | 0.000 | 0.000 | 0.000 | 0.002 | 0.100 |
| Cronobacter | Cronobacter | 0.054 | 0.000 | 0.000 | 0.002 | 0.007 | 0.890 |
| Curvibacter | Curvibacter | 0.000 | 0.000 | 0.000 | 0.000 | 0.000 | 0.023 |
| Dermabacter | Dermabacter | 0.064 | 0.000 | 0.000 | 0.004 | 0.013 | 0.088 |
| Desulfotomaculum | Desulfotomaculum | 0.000 | 0.000 | 0.000 | 0.000 | 0.000 | 0.004 |
| Dialister | Dialister | 4.603 | 0.000 | 0.030 | 0.502 | 0.943 | 5.743 |
| Dielma | Dielma | 0.102 | 0.000 | 0.000 | 0.005 | 0.013 | 0.330 |
| Dorea | Dorea | 4.866 | 0.066 | 1.159 | 1.382 | 0.972 | 9.236 |
| Eggerthella | Eggerthella | 0.269 | 0.000 | 0.006 | 0.028 | 0.050 | 0.841 |
| Eikenella | Eikenella | 0.000 | 0.000 | 0.000 | 0.000 | 0.000 | 0.055 |
| Elusimicrobium | Elusimicrobium | 0.000 | 0.000 | 0.000 | 0.000 | 0.000 | 0.019 |
| Enterobacter | Enterobacter | 4.974 | 0.000 | 0.000 | 0.180 | 0.723 | 11.714 |
| Enterococcus | Enterococcus | 0.161 | 0.000 | 0.000 | 0.009 | 0.034 | 29.177 |
| Epulopiscium | Epulopiscium | 0.075 | 0.000 | 0.000 | 0.001 | 0.008 | 0.129 |
| Facklamia | Facklamia | 0.518 | 0.000 | 0.000 | 0.017 | 0.072 | 1.273 |
| Fibrobacter | Fibrobacter | 0.072 | 0.000 | 0.000 | 0.005 | 0.015 | 0.437 |
| Flavobacterium | Flavobacterium | 0.784 | 0.000 | 0.000 | 0.124 | 0.214 | 1.101 |
| Fusobacterium | Fusobacterium | 1.267 | 0.000 | 0.000 | 0.031 | 0.165 | 1.425 |
| Gallibacterium | Gallibacterium | 0.000 | 0.000 | 0.000 | 0.000 | 0.000 | 0.002 |
| Gemella | Gemella | 0.040 | 0.000 | 0.000 | 0.001 | 0.005 | 0.132 |
| Granulicatella | Granulicatella | 0.042 | 0.000 | 0.000 | 0.003 | 0.006 | 0.088 |
| Haemophilus | Haemophilus | 0.396 | 0.000 | 0.000 | 0.030 | 0.072 | 6.084 |
| Hafnia | Hafnia | 0.073 | 0.000 | 0.000 | 0.001 | 0.008 | 0.194 |
| Holdemania | Holdemania | 0.070 | 0.000 | 0.006 | 0.008 | 0.011 | 0.121 |
| Intestinimonas | Intestinimonas | 0.868 | 0.000 | 0.060 | 0.108 | 0.148 | 0.991 |
| Klebsiella | Klebsiella | 1.572 | 0.000 | 0.000 | 0.033 | 0.173 | 4.950 |
| Kluyvera | Kluyvera | 16.922 | 0.000 | 0.034 | 0.755 | 2.366 | 24.345 |
| Kocuria | Kocuria | 0.000 | 0.000 | 0.000 | 0.000 | 0.000 | 0.005 |
| Lachnoanaerobaculum | Lachnoanaerobaculum | 0.002 | 0.000 | 0.000 | 0.000 | 0.000 | 0.002 |
| Lachnospira | Lachnospira | 7.017 | 0.000 | 0.553 | 1.076 | 1.313 | 10.101 |
| Lactobacillus | Lactobacillus | 2.847 | 0.000 | 0.012 | 0.186 | 0.539 | 4.413 |
| Lactonifactor | Lactonifactor | 0.186 | 0.000 | 0.000 | 0.010 | 0.028 | 0.368 |
| Leptotrichia | Leptotrichia | 0.008 | 0.000 | 0.000 | 0.000 | 0.001 | 0.011 |
| Megasphaera | Megasphaera | 2.235 | 0.000 | 0.001 | 0.106 | 0.354 | 4.894 |
| Methanobrevibacter | Methanobrevibacter | 3.309 | 0.000 | 0.000 | 0.369 | 0.772 | 3.569 |
| Methylobacterium | Methylobacterium | 0.005 | 0.000 | 0.000 | 0.000 | 0.001 | 0.021 |
| Murdochiella | Murdochiella | 2.642 | 0.000 | 0.002 | 0.120 | 0.361 | 9.210 |
| Nosocomiicoccus | Nosocomiicoccus | 0.000 | 0.000 | 0.000 | 0.000 | 0.000 | 0.051 |
| Olsenella | Olsenella | 0.086 | 0.000 | 0.000 | 0.004 | 0.014 | 0.099 |
| Oscillibacter | Oscillibacter | 0.499 | 0.000 | 0.017 | 0.078 | 0.120 | 0.666 |
| Oscillospira | Oscillospira | 0.660 | 0.000 | 0.025 | 0.063 | 0.119 | 1.394 |
| Papillibacter | Papillibacter | 0.143 | 0.000 | 0.000 | 0.005 | 0.017 | 0.159 |
| Paraprevotella | Paraprevotella | 4.565 | 0.000 | 0.000 | 0.256 | 0.767 | 5.652 |
| Parvibacter | Parvibacter | 0.037 | 0.000 | 0.000 | 0.003 | 0.007 | 0.039 |
| Pasteurella | Pasteurella | 0.253 | 0.000 | 0.000 | 0.003 | 0.026 | 1.610 |
| Pediococcus | Pediococcus | 0.011 | 0.000 | 0.000 | 0.000 | 0.001 | 0.202 |
| Peptostreptococcus | Peptostreptococcus | 2.837 | 0.000 | 0.000 | 0.102 | 0.400 | 3.225 |
| Phascolarctobacterium | Phascolarctobacterium | 2.437 | 0.000 | 0.357 | 0.526 | 0.612 | 4.569 |
| Phyllobacterium | Phyllobacterium | 0.020 | 0.000 | 0.000 | 0.001 | 0.003 | 0.055 |
| Prevotella | Prevotella | 6.897 | 0.000 | 0.027 | 0.491 | 1.262 | 16.886 |
| Propionibacterium | Propionibacterium | 0.045 | 0.000 | 0.000 | 0.002 | 0.006 | 0.266 |
| Pseudobutyrivibrio | Pseudobutyrivibrio | 7.491 | 0.114 | 1.800 | 2.280 | 1.600 | 8.839 |
| Rahnella | Rahnella | 0.006 | 0.000 | 0.000 | 0.000 | 0.001 | 0.328 |
| Ruminiclostridium | Ruminiclostridium | 0.000 | 0.000 | 0.000 | 0.000 | 0.000 | 0.008 |
| Scardovia | Scardovia | 0.000 | 0.000 | 0.000 | 0.000 | 0.000 | 0.005 |
| Sedimentibacter | Sedimentibacter | 0.015 | 0.000 | 0.000 | 0.000 | 0.002 | 0.038 |
| Shuttleworthia | Shuttleworthia | 0.096 | 0.000 | 0.000 | 0.007 | 0.017 | 0.430 |
| Solobacterium | Solobacterium | 0.357 | 0.000 | 0.000 | 0.004 | 0.037 | 0.402 |
| Sphaerochaeta | Sphaerochaeta | 0.000 | 0.000 | 0.000 | 0.000 | 0.000 | 0.038 |
| Sporobacter | Sporobacter | 0.041 | 0.000 | 0.000 | 0.004 | 0.009 | 0.075 |
| Streptococcus | Streptococcus | 8.210 | 0.000 | 0.133 | 0.486 | 1.247 | 9.320 |
| Syntrophococcus | Syntrophococcus | 0.038 | 0.000 | 0.000 | 0.001 | 0.006 | 0.050 |
| Terrisporobacter | Terrisporobacter | 0.700 | 0.000 | 0.073 | 0.150 | 0.183 | 1.900 |
| Trichococcus | Trichococcus | 0.000 | 0.000 | 0.000 | 0.000 | 0.000 | 0.188 |
| Ureaplasma | Ureaplasma | 0.000 | 0.000 | 0.000 | 0.000 | 0.000 | 0.012 |
| Veillonella | Veillonella | 0.261 | 0.000 | 0.001 | 0.016 | 0.036 | 2.070 |
| Victivallis | Victivallis | 0.562 | 0.000 | 0.000 | 0.044 | 0.107 | 1.069 |
| Weissella | Weissella | 0.039 | 0.000 | 0.000 | 0.001 | 0.005 | 2.881 |
The “Unhealthy” column shows the largest abundance seen in an unhealthy person. Mean and median values for healthy people might be much lower, but to be on this chart the unhealthy person must have a number above that range.