Microbe numbers shift daily in response to your environment, so a single sample won’t give much more than a brief snapshot at a single point in time. But in over 600 tests under a variety of conditions, what did I find?
My Oral Microbiome*
The first place that microbes enter is also one of the richest and most variable environments in the body.
Scientists added an odorless compound from wine to a culture of known oral bacteria, and sure enough: the bacteria generated compounds that we can smell: terpenes, benzenic compounds and lipid derivatives. Each of us has a unique oral microbiome, and scientists were able to that that this inter-person variability is large enough to explain at least some of the differences in how each of us perceive a glass of wine.
What are the most important species in my mouth?
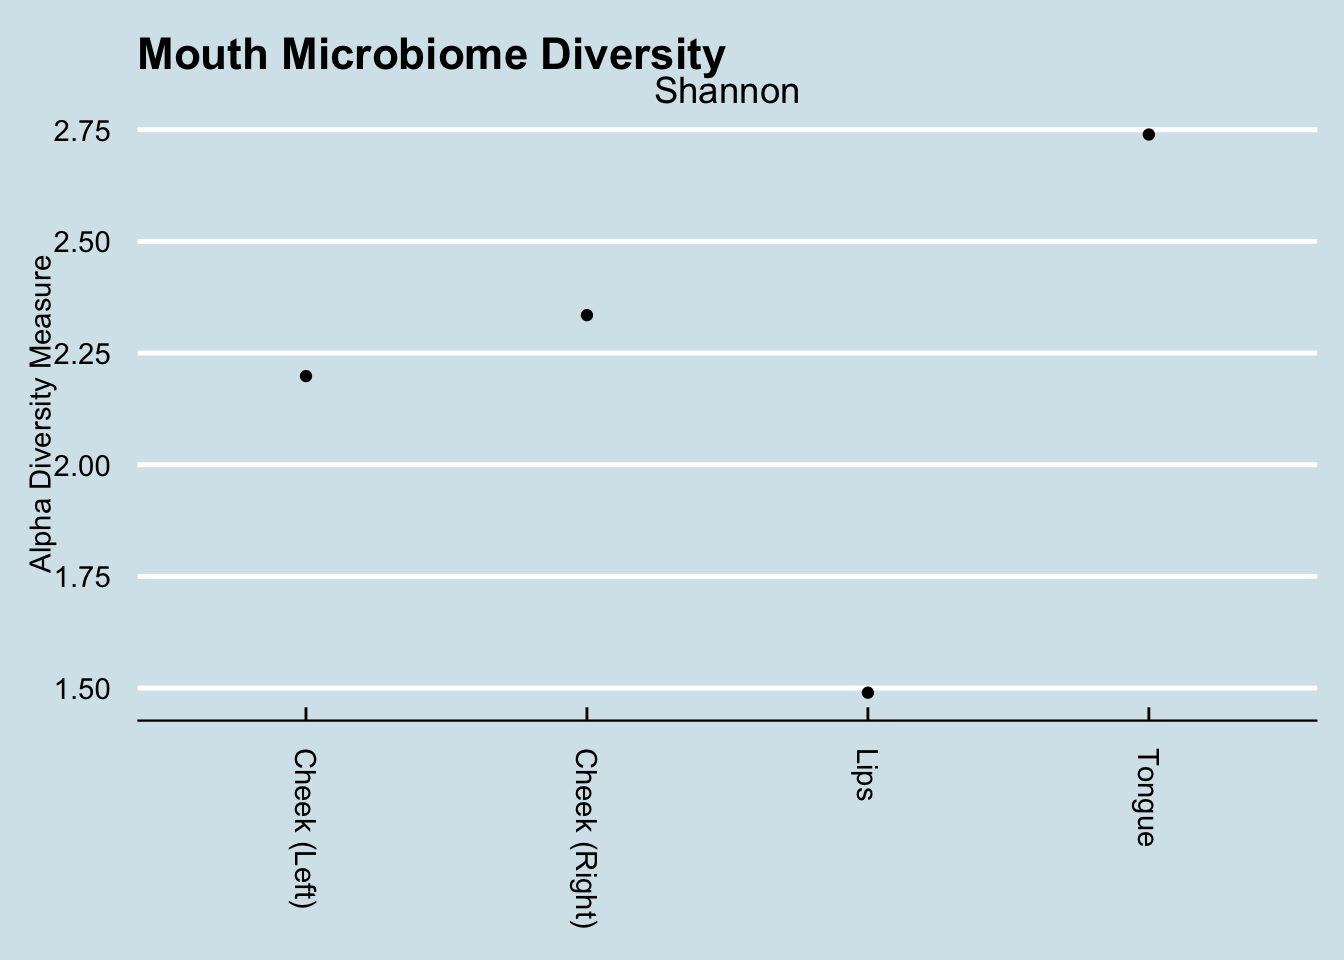
To microbes, your body looks like a hollow tube: skin on the outside, gut on the inside, and a mouth to allow passage between the two. Like purgatory, the mouth is a gatekeeper where new microbes wait before being whisked into the heavenly warm breeding grounds of the digestive system. But it’s no easy waiting room either - the mouth contains many highly-distinct eco-systems, each as different from one another as the Sahara desert is to the bottom of the ocean. Most microbiome and genetic tests ask you to swab the inside of the cheek - an easy, straightforward place teeming with bacteria, but the bacteria in the cheeks can be very different from those on the tongue or the lips. I tested them all one morning right after waking up.
|
|
Lips
|
Tongue
|
Cheek (Right)
|
Cheek (Left)
|
|
Streptococcus
|
57.36
|
6.44
|
38.41
|
43.42
|
|
Haemophilus
|
19.61
|
4.97
|
6.36
|
7.59
|
|
Gemella
|
8.47
|
2.23
|
10.67
|
12.64
|
|
Actinobacillus
|
3.07
|
0.26
|
3.91
|
3.32
|
|
Veillonella
|
2.14
|
7.70
|
1.81
|
2.20
|
|
Granulicatella
|
1.60
|
0.88
|
2.13
|
2.36
|
|
Neisseria
|
1.47
|
14.91
|
7.51
|
4.12
|
|
Fusobacterium
|
1.24
|
14.99
|
5.94
|
6.96
|
|
Porphyromonas
|
1.10
|
3.37
|
3.56
|
2.78
|
|
Rothia
|
0.90
|
0.21
|
6.49
|
2.83
|
|
Actinomyces
|
0.69
|
2.26
|
2.90
|
2.11
|
|
Prevotella
|
0.45
|
13.31
|
1.09
|
1.73
|
|
Alloprevotella
|
0.42
|
2.76
|
0.46
|
0.36
|
|
Leptotrichia
|
0.22
|
8.20
|
1.64
|
1.96
|
|
Capnocytophaga
|
0.20
|
3.87
|
0.59
|
0.64
|
|
Pasteurella
|
0.10
|
0.02
|
2.28
|
0.87
|
|
Lachnoanaerobaculum
|
0.04
|
1.19
|
0.09
|
0.19
|
|
Campylobacter
|
0.03
|
2.05
|
0.39
|
0.50
|
|
Johnsonella
|
0.02
|
1.43
|
0.07
|
0.12
|
|
Bacteroides
|
0.00
|
0.00
|
0.95
|
0.23
|
Dramatic differences in the types of microbes in each part of the mouth.
While there is some variation in the cheeks, there is a dramatic difference between them and the lips or tongue. Also interesting is the way the lips are dominated by just three taxa that make up more than 85% of the total abundance. In Inverse Simpson terms, the lips are the least diverse, whereas the tongue is the most diverse.
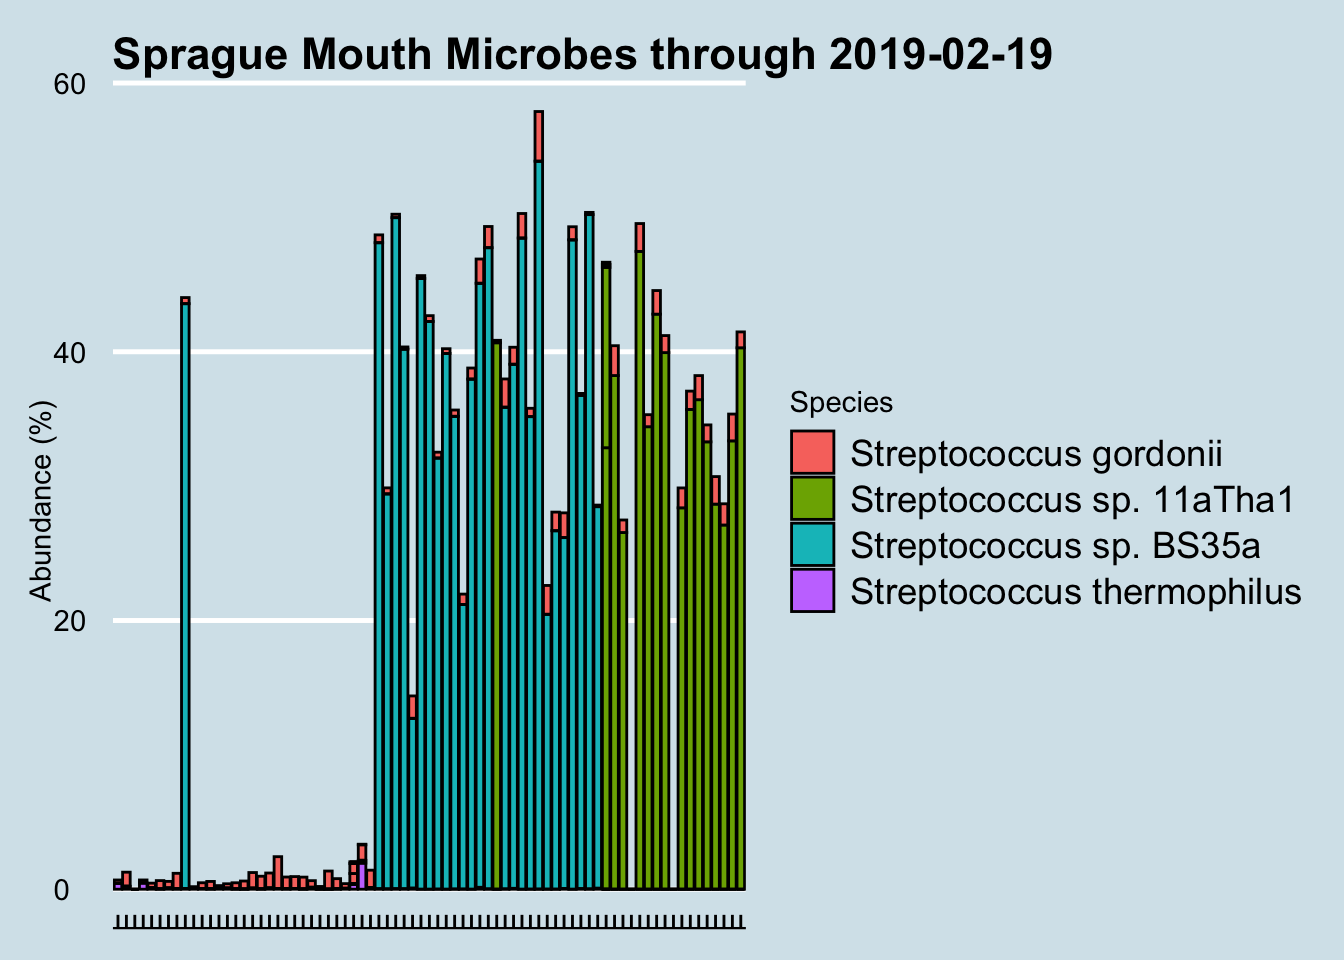
Regular testing of my microbiome often yields unexpected surprises, and this one has me stumped. Beginning in December 2016 and for no apparent reason, my mouth was colonized suddenly by a particular species of Streptococcus that had not been there before. Why? I’m not aware of any major lifestyle or other changes to cause this: same toothpaste, same living conditions. A few dietary experiments here and there, but nothing that coincides with these changes.
At the species level, I eliminated all samples with under 10,000 reads. We see something interesting: for no apparent reason, the species of Streptococcus detected in my mouth has changed. Suddenly, in December 2016 my mouth was colonized by a particular species that had not been there before. Why? I hadn’t done anything special; I’m not aware of any major lifestyle or other changes to cause this.
I confirmed with the lab that it’s not contamination. What’s especially odd is that I experienced a shift like this twice now in one year. After comfortably floating along with Species Streptococcus sp. BS35a for more than six months, suddenly in August the balance shifted again, this time to Streptococcus sp. 11aTha1. Will it shift again? Who knows?
I confirmed with the lab that it’s not contamination.
What’s especially odd is that I experienced a shift like this twice now in one year. After comfortably floating along with Species Streptococcus sp. BS35a for more than six months, suddenly in August the balance shifted again, this time to Streptococcus sp. 11aTha1. Will it shift again? Who knows?
Earth’s atmosphere was originally void of oxygen, a poisonous gas to the first, so-called “anaerobic” bacteria who thrived precisely because there was no oxygen. Over eons, as oxygen levels increased these microbes found places to hide: deep, dark pockets inside multicellular creatures who traded an oxygen-free interior for the abundant, exotic metabolites the microbes could synthesize. In humans, these bacterial safe-houses begin in the mouth, where the oxygen is low enough to keep the lights on for the anaerobes, while allowing occasional blooms for the aerobic bacteria that thrive whenever the mouth is open and they find fresh air.
Most of them do apparently need moisture: your salivary glands, strategically located in your cheeks and at the bottom of the mouth, churn out 1–2 liters of saliva per day.
The complexity of the mouth microbiome is compounded by the variety of surfaces, hard and soft, each with its own propensity to allow the formation of biofilms, tenacious clusters that protect microbes against invaders. On teeth, we call it dental plaque, a favorite protective breeding ground of Streptococcus mutans, the cavity-causing villain that, once established, is hard to dislodge. I’m fortunate that my mouth microbiome appears to have none of this and it’s true that I never have cavities. I’ve seen levels as high as 2% in some people, who have to visit the dentist no matter how much they brush.
Most microbes go down the hatch to the stomach, of course, but overly-aggressive tooth brushing or dental work can let a few can sneak into the bloodstream directly, where they can find their way to the lungs, the liver, or the heart, sometimes with deadly consequences. The “viridans” streptococci are one well-studied example: beneficial in the mouth, they outcompete other streptococcus enough to prevent strep throat, yet are the leading cause of heart valve infections if they make it into the bloodstream.
These mouth microbes have other interesting properties that may affect much more than we think. When scientists added an odorless compound from wine to a culture of known oral bacteria, the bacteria generated compounds that we can smell: terpenes, benzenic compounds and lipid derivatives. Each of us has a unique oral microbiome, and the experimenters were able to show that this inter-person variability is large enough to explain at least some of the differences in how each of us perceive a glass of wine.
So what about these odd new ones that showed up in my mouth?
I’ve looked up their names in every reference I can think of, but have found nothing. That’s not too surprising: about a third of oral microbes are known only by their gene sequences. The most satisfying answer from a microbiology expert I consulted is that these are likely to be “passenger microbes”, doing nothing in particular helpful or harmful.
In other words, like so many other microbes in our environment, they are just along for the ride.
My Nose Microbiome
Springtime for many people brings hay fever, an allergic reaction known to be associated with the microbiome. I fortunately don’t suffer from the condition, but I wondered if maybe I could find something in my nose microbiome that would show a seasonal shift, perhaps something aligned with allergy season. Even if I don’t have symptoms, maybe by finding some of the key microbes involved my data might be useful to others who would like to explore more of the link between their allergies and microbes.
Like every place on the body, your nose has its own unique microbial ecology, as different from other sites as a tropical rainforest is from the artic tundra. Unlike the gut or the mouth, your nose is in constant contact with the external environment, exposed to new microbes that float in day and night with every breath you take.
It seems reasonable to expect that we’d see different microbes floating in our environment as the seasons shift. After all, changes in temperature, humidity, and daylight affect the abundance and variety of plants, so of course these shifts will affect microbes. But is there a pattern to the changes?
To find out, I sampled my nose microbiome more than 50 times over a period of three years, carefully tracking the date and microbial species in each sample. In all, I found more than 200 different (genus-level) bacteria from about 350 unique species.
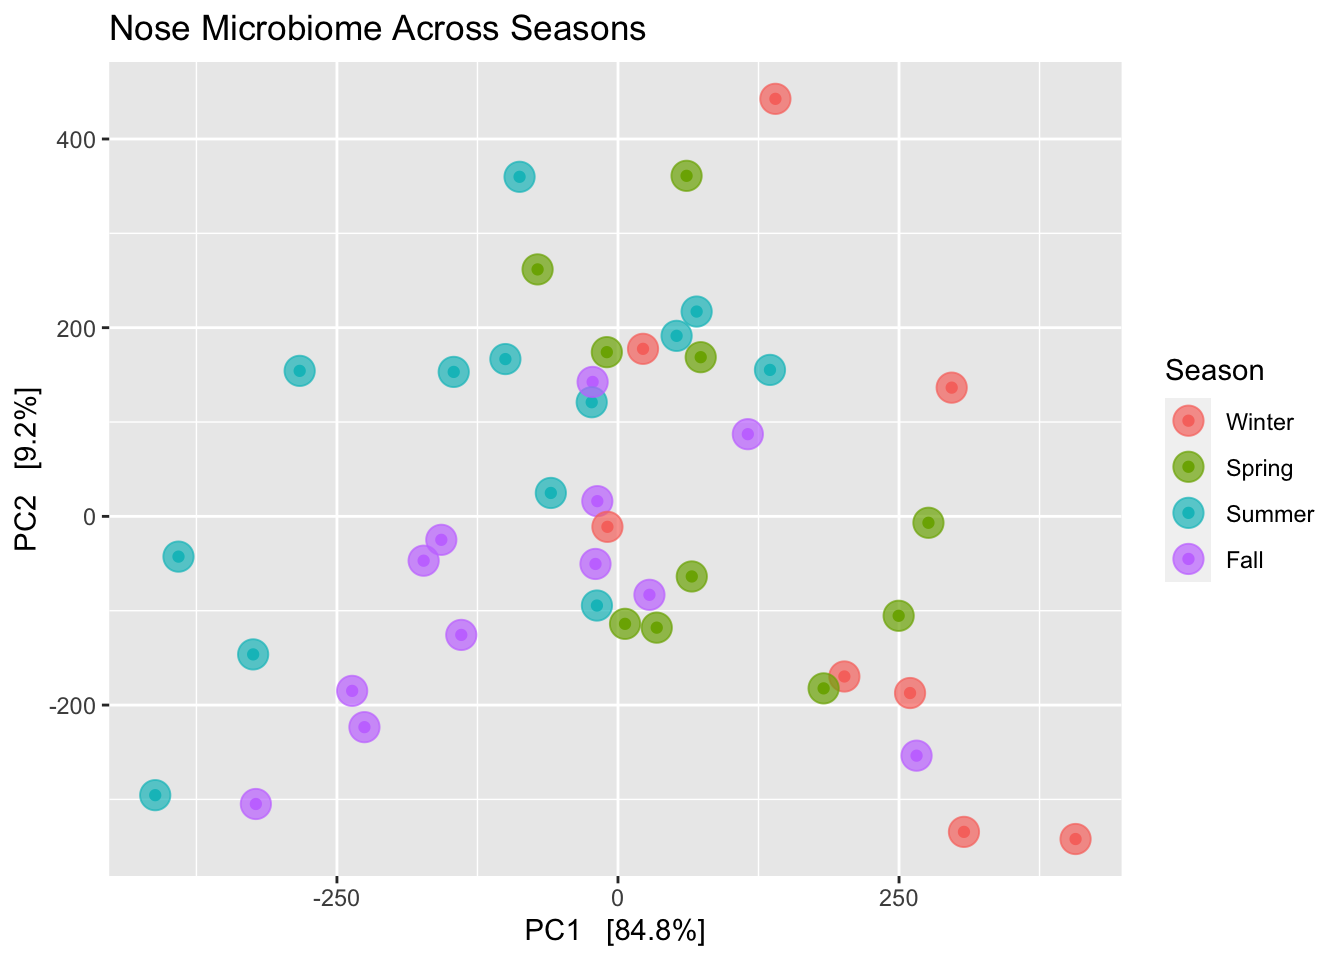
Using a versatile clustering algorithm called non-metric multidimension scaling (NMDS), I calculated the statistical correlations among the hundreds of microbes in a way that let me build a two-dimension chart where similar samples are clustered together, and less-similar samples are further apart. Where there are significant differences among samples, an NMDS chart will show obvious clustering, with similar samples bunched together and separate from other clusters.
I couldn’t see any patterns when I generated an NMDS clustering diagram on the whole data set, which includes samples taken in multiple geographies. When I looked only at those samples taken in a single geography, my home , the results were a little more, well, consistent with a theory that seasons matter. (Figure 13.3)
Okay, this chart is kind of a mess. If there were major shifts, we’d see clear clusters. Although we don’t quite see that, it is interesting that the seasons do kinda-sorta hang together with much overlap. For example, the (red) winter dots are all on the right side of the chart, with the (blue) summer dots mostly on the left. The (purple) fall dots are, if anything, closer to the winter samples, and (green) spring is closer to summer. Both spring and fall were more in the middle, which you might kinda-sorta expect given that they are generally less extreme than the other two seasons.
Importantly, each of the samples was taken under the same conditions: I swabbed the nostrils for about 30 seconds right after waking up each morning. Since my bedroom is kept at a climate-controlled temperature year-round, these samples wouldn’t show direct results of major seasonal changes, though microbes in my bedroom are presumably affected somewhat by what’s happening outdoors. I also have a number of samples taken in different geographies while traveling, but I removed them before making this chart.
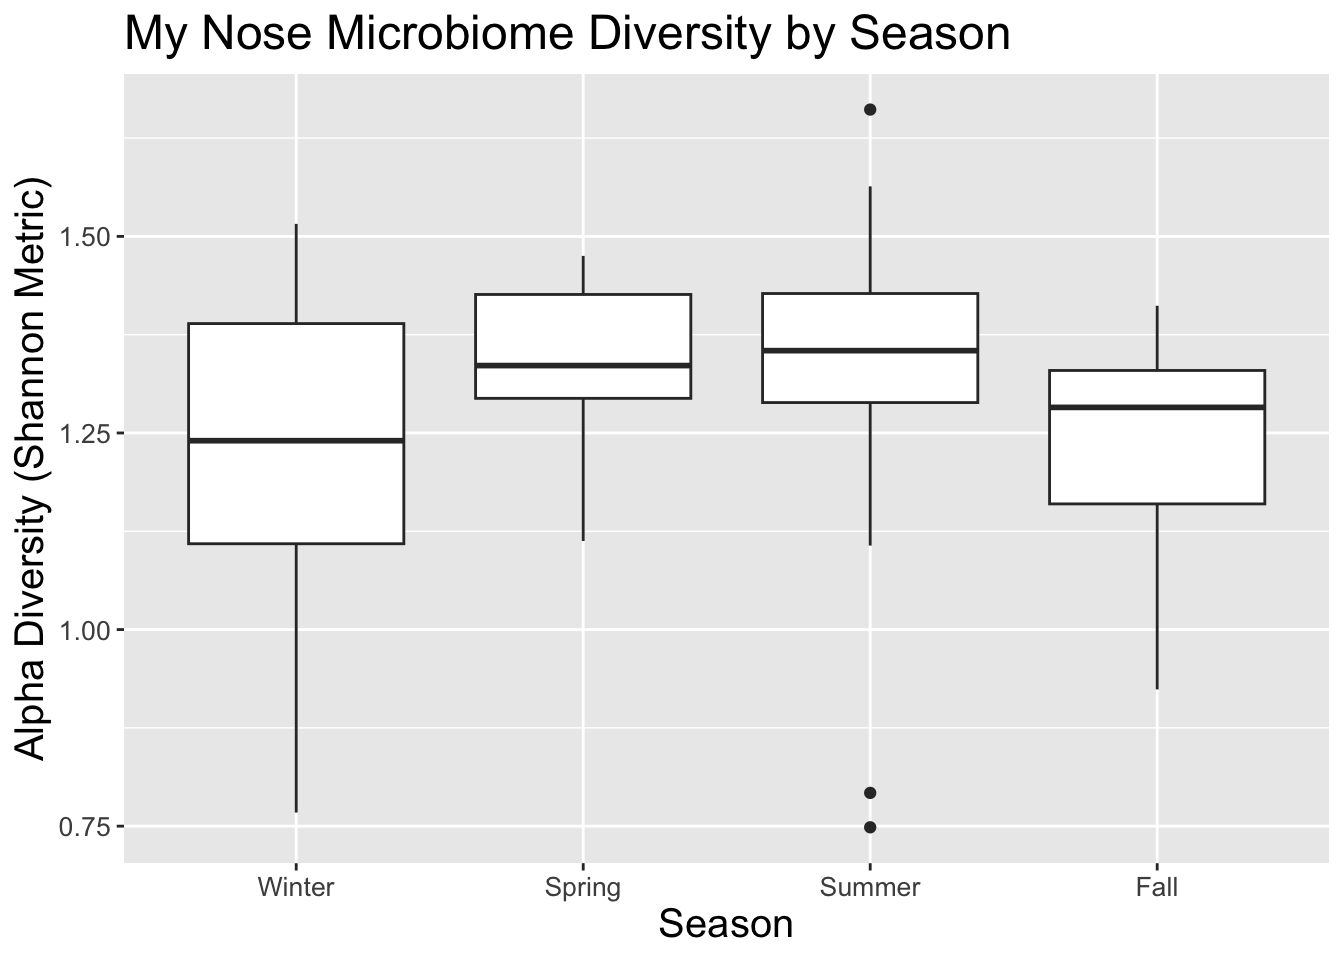
What about the richness and diversity of microbes throughout the year? The box plot in Figure 13.4 shows that summer has the widest diversity range (those dots outside the main box are outliers). In this plot, the area in the box represents 50% of the samples, and the line through the middle is the median diversity.
I spend more time indoors in the winter, so perhaps that explains why median diversity is lowest then. Again, it’s interesting that both spring and fall have similar diversities to each other, perhaps because both seasons have similar amounts of indoor-outdoor time and maybe the variety of microbes reflect that.
Is it just me? Can I learn anything by comparing my nose microbes to other people? I ran several analyses against other people but so far haven’t found much.
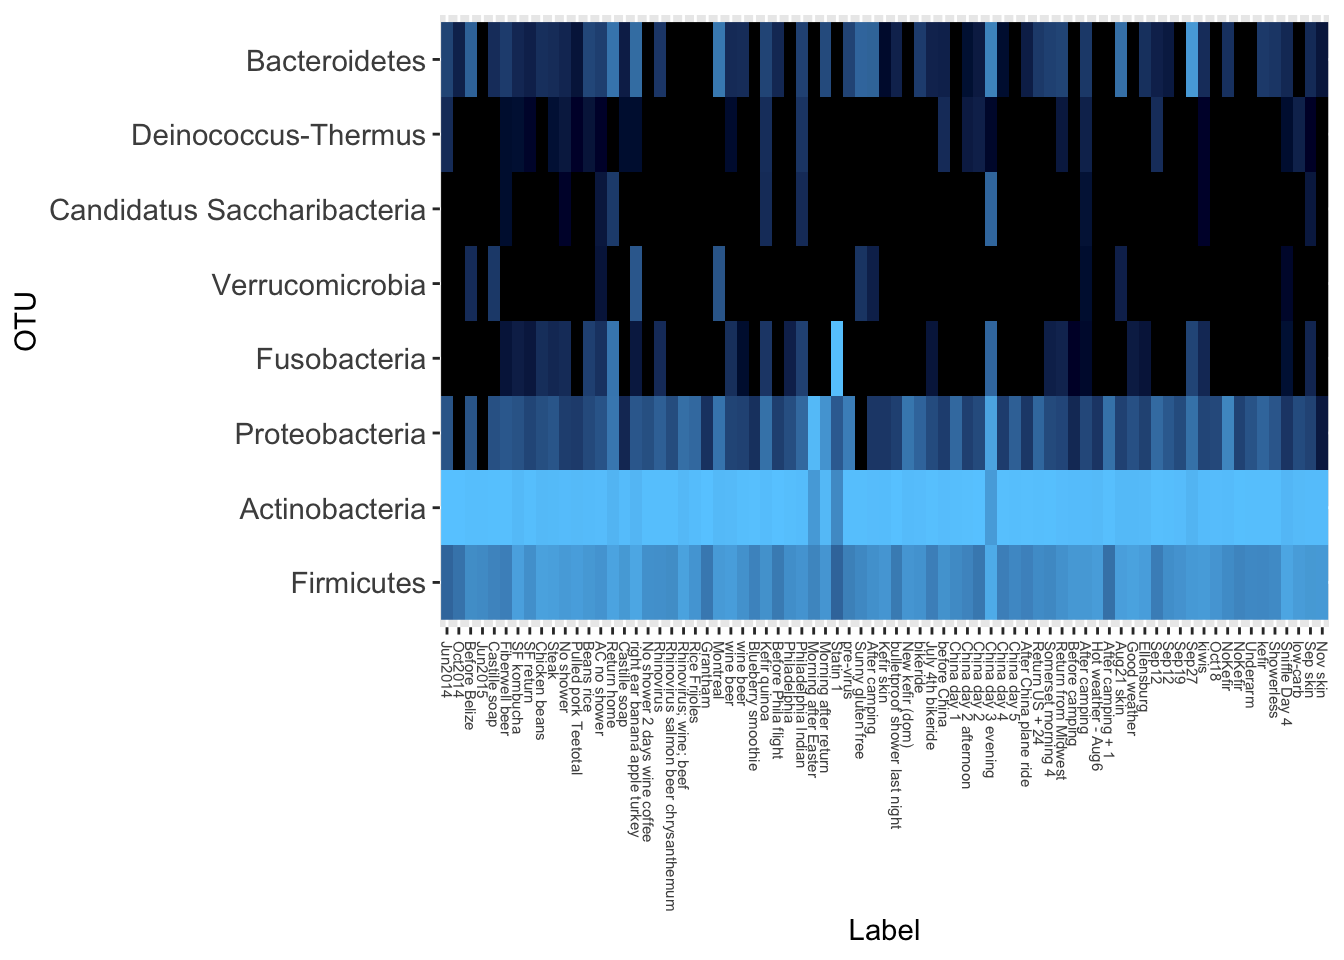
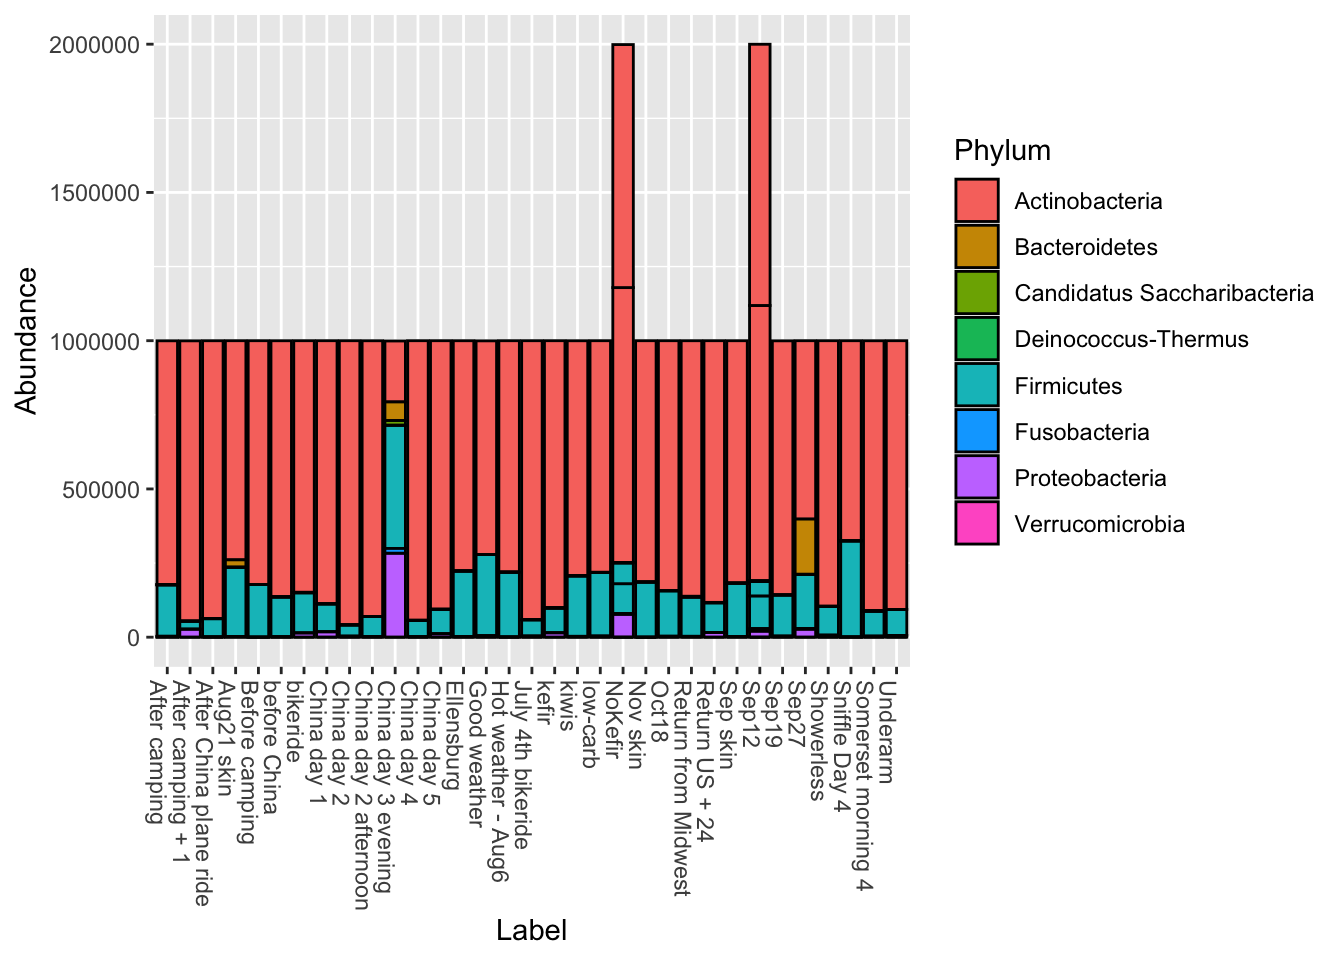
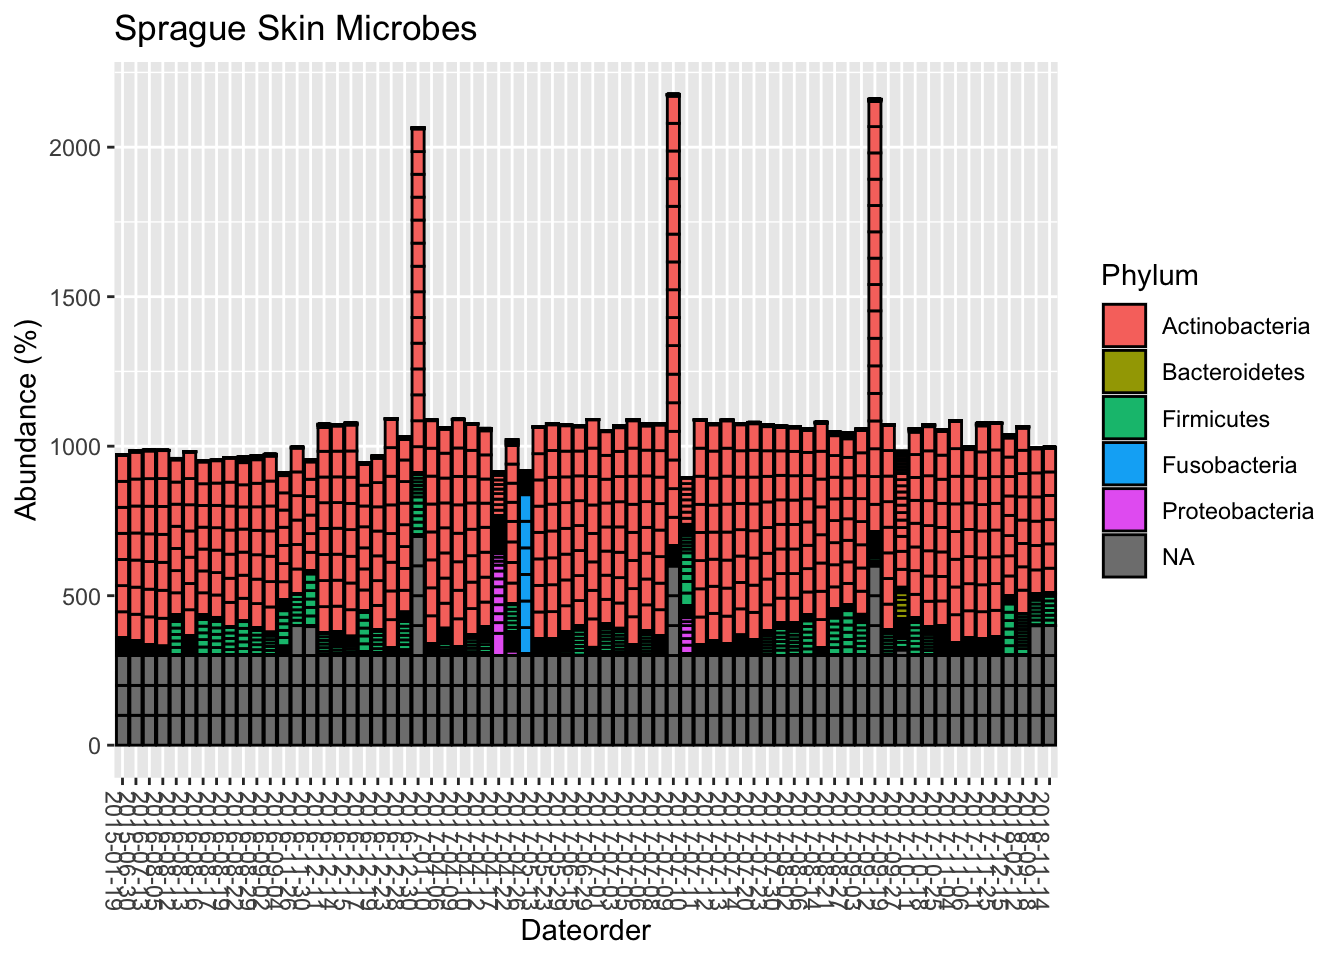
My Skin Microbiome*
Microbes of the gut are important, but many other organisms are crawling all over you too. What can we learn from studying my skin samples?
Like the gut, the vast majority come from only two genera.
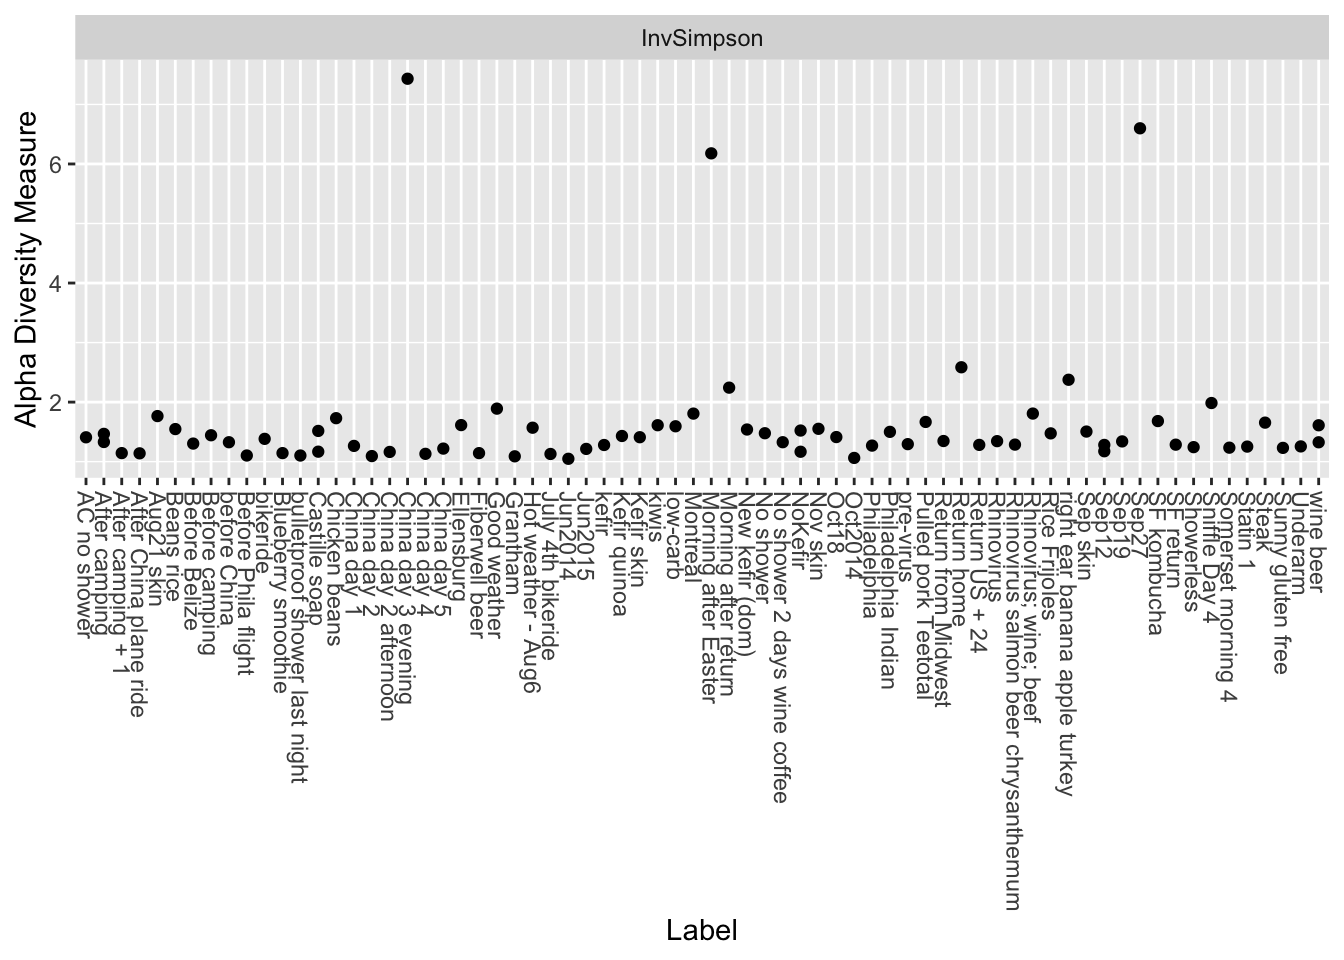
And here’s the diversity:
Is it just me? I also looked at the many other samples people have sent. Like me, most of them are dominated by Actinobacteria and Firmicutes, with a tiny bit of Proteobacteria and even smaller amounts of others. At the genus level, the vast majority are Propionibacterium and Staphylococcus, with an occasional spike of that smelly Corynebacterium.
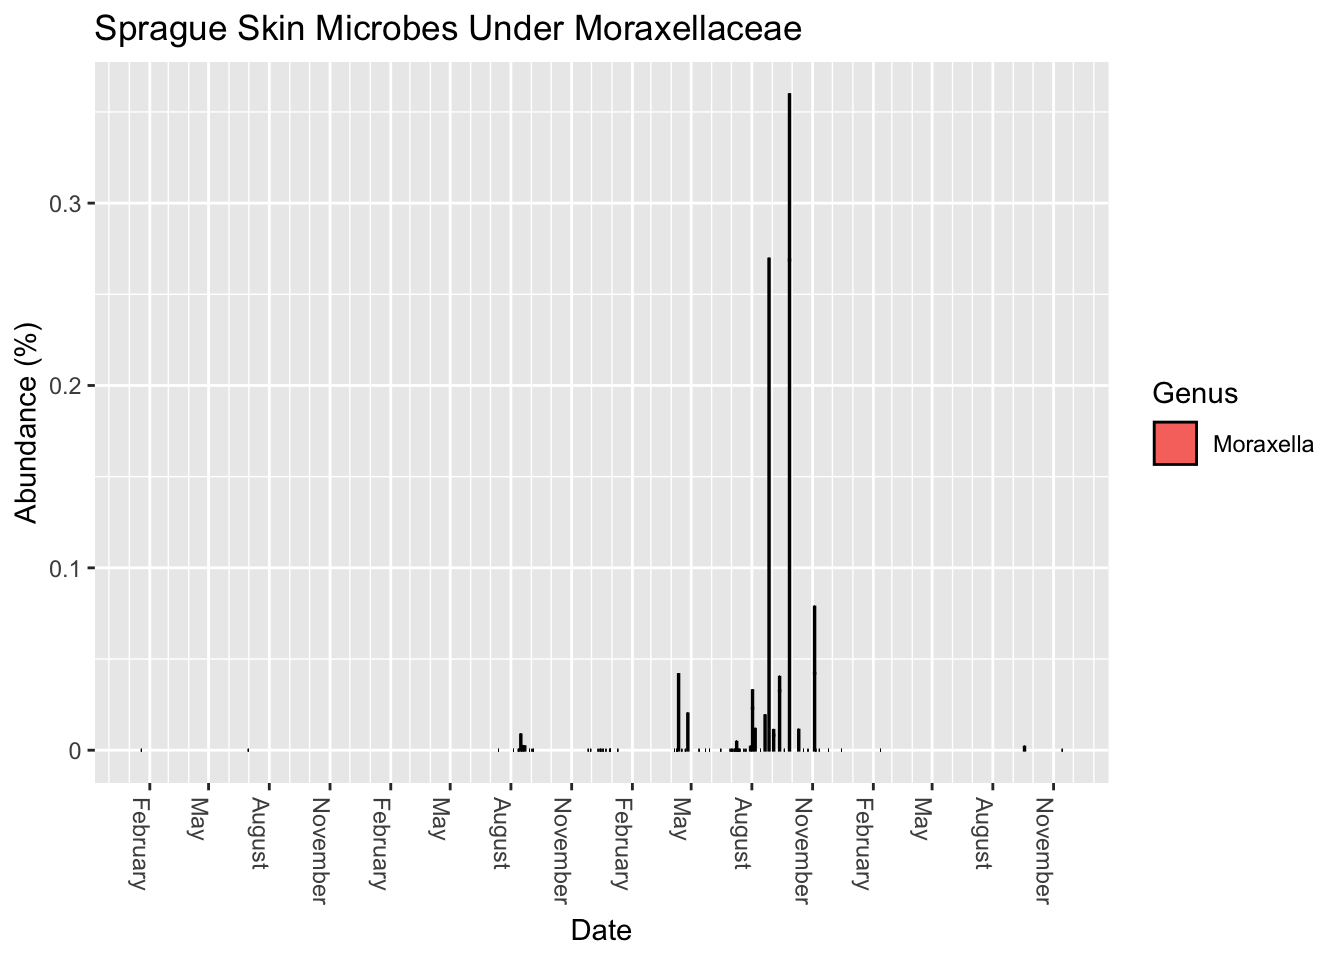
A recent paper published in Nature warned that several pathogens are lurking in common kitchen sponges. In particular, it noted the abundance of Moraxellaceae, a common skin bacterium. How much do I have?
Apparently I have a small amount, depending on when I sample.
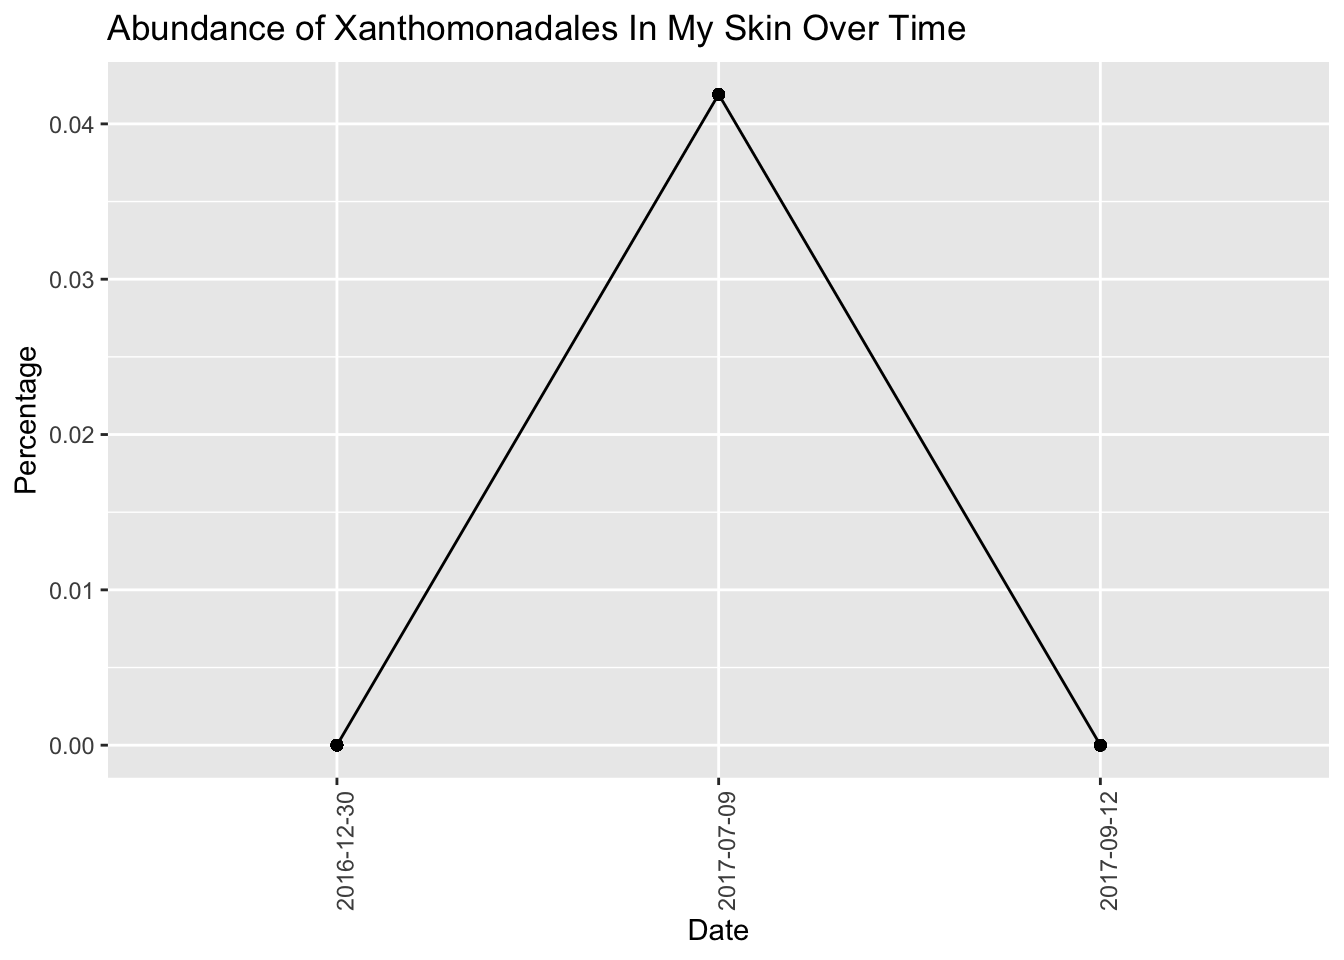
Now look at an odd new bacteria that showed up in some of my samples from Spring 2017 (Figure 13.5)
Not sure what this could be doing.
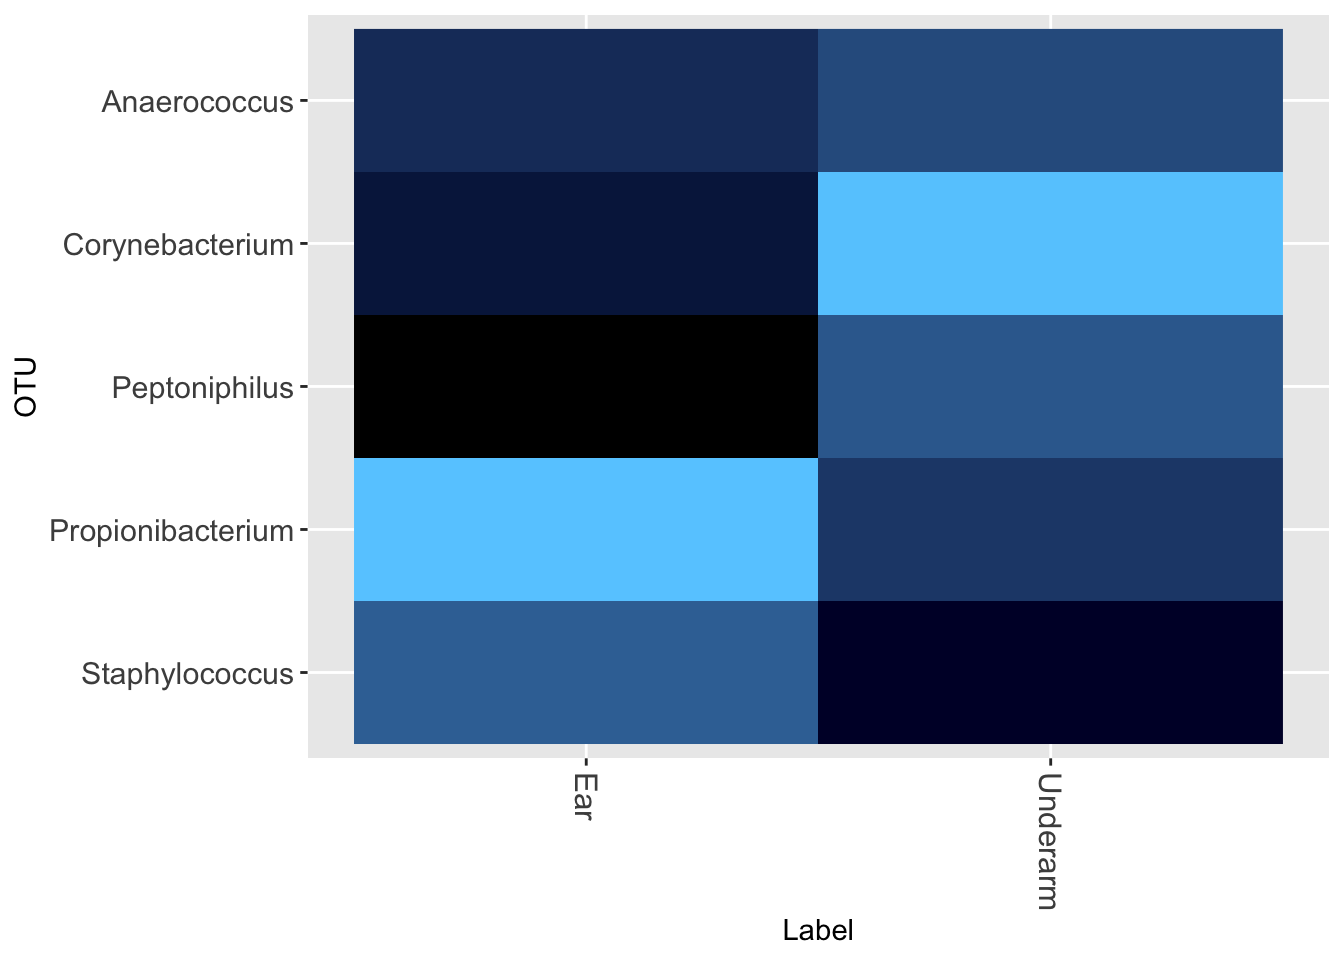
Body odor
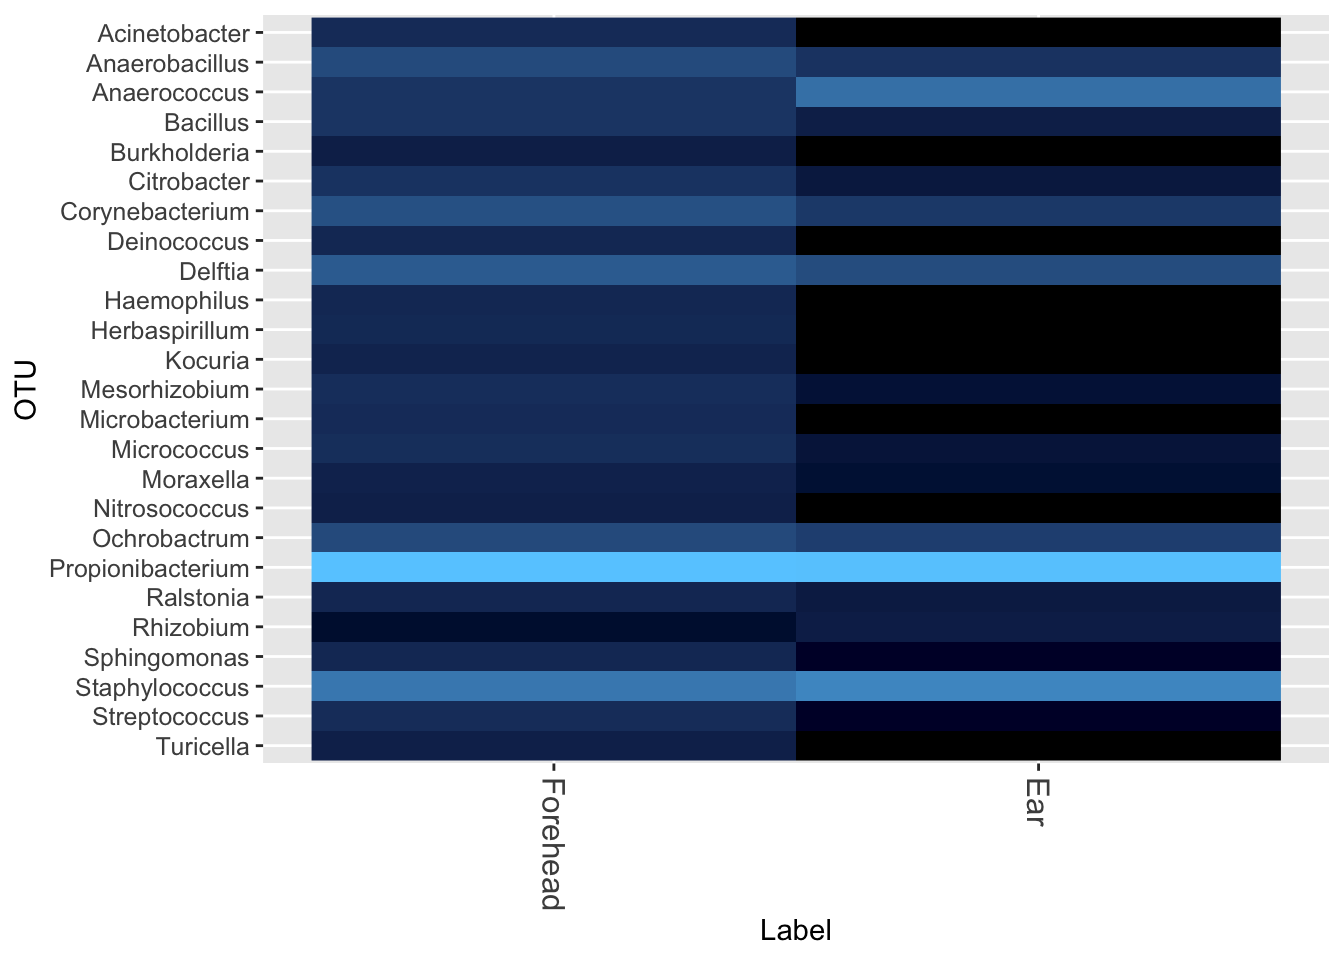
That unpleasant smell from you underarms is caused by Corynebacteria. Perhaps there is a relationship between what I find behind my ear and other parts of the body. Let’s check (Figure 13.6)
I also tested the difference between behind-the-ear (the normal way) and on the forehead (Figure 13.7)
And the underarm versus behind the ear (Figure 13.8)
Once again, sampling site matters: there is a significant difference in the type of microbe behind the ear compared to the forehead. Incidentally, notice in the underarm the much higher abundance of Corynebacterium, which produces that distinctive smell of body odor.
See the Appendix for an overall summary of my skin experiments
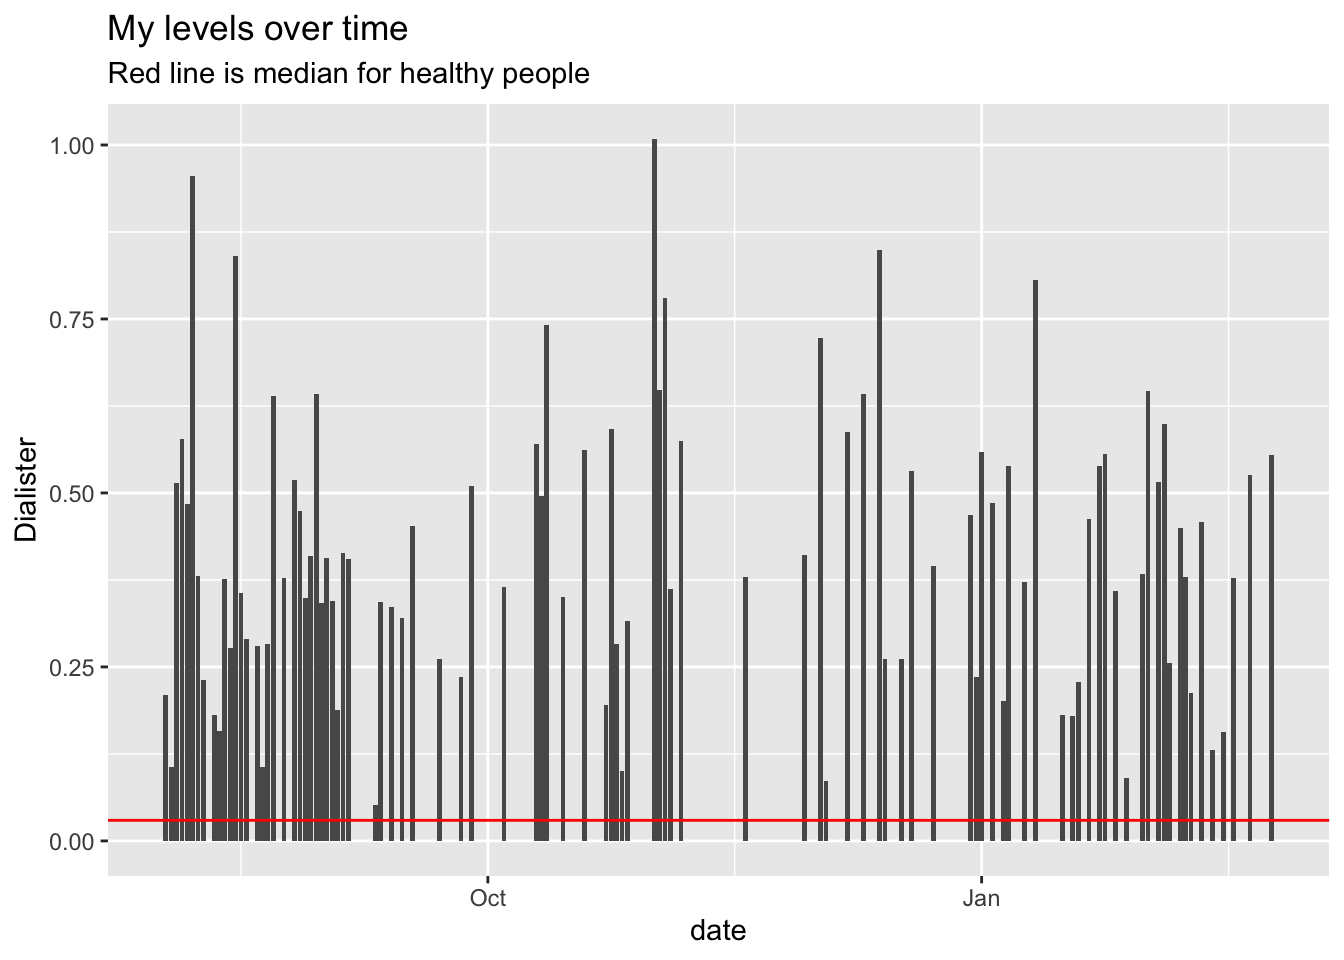
Are my Dialister levels normal?
A well-done 2019 study found that people suffering from depression have significantly lower levels of two groups of bacteria, Dialister and Coprococcus, possibly due to a potential ability of the gut microbiome to synthesize 3,4-dihydroxyphenylacetic acid, a breakdown product of the neurotransmitter dopamine
How are my levels of Dialister?
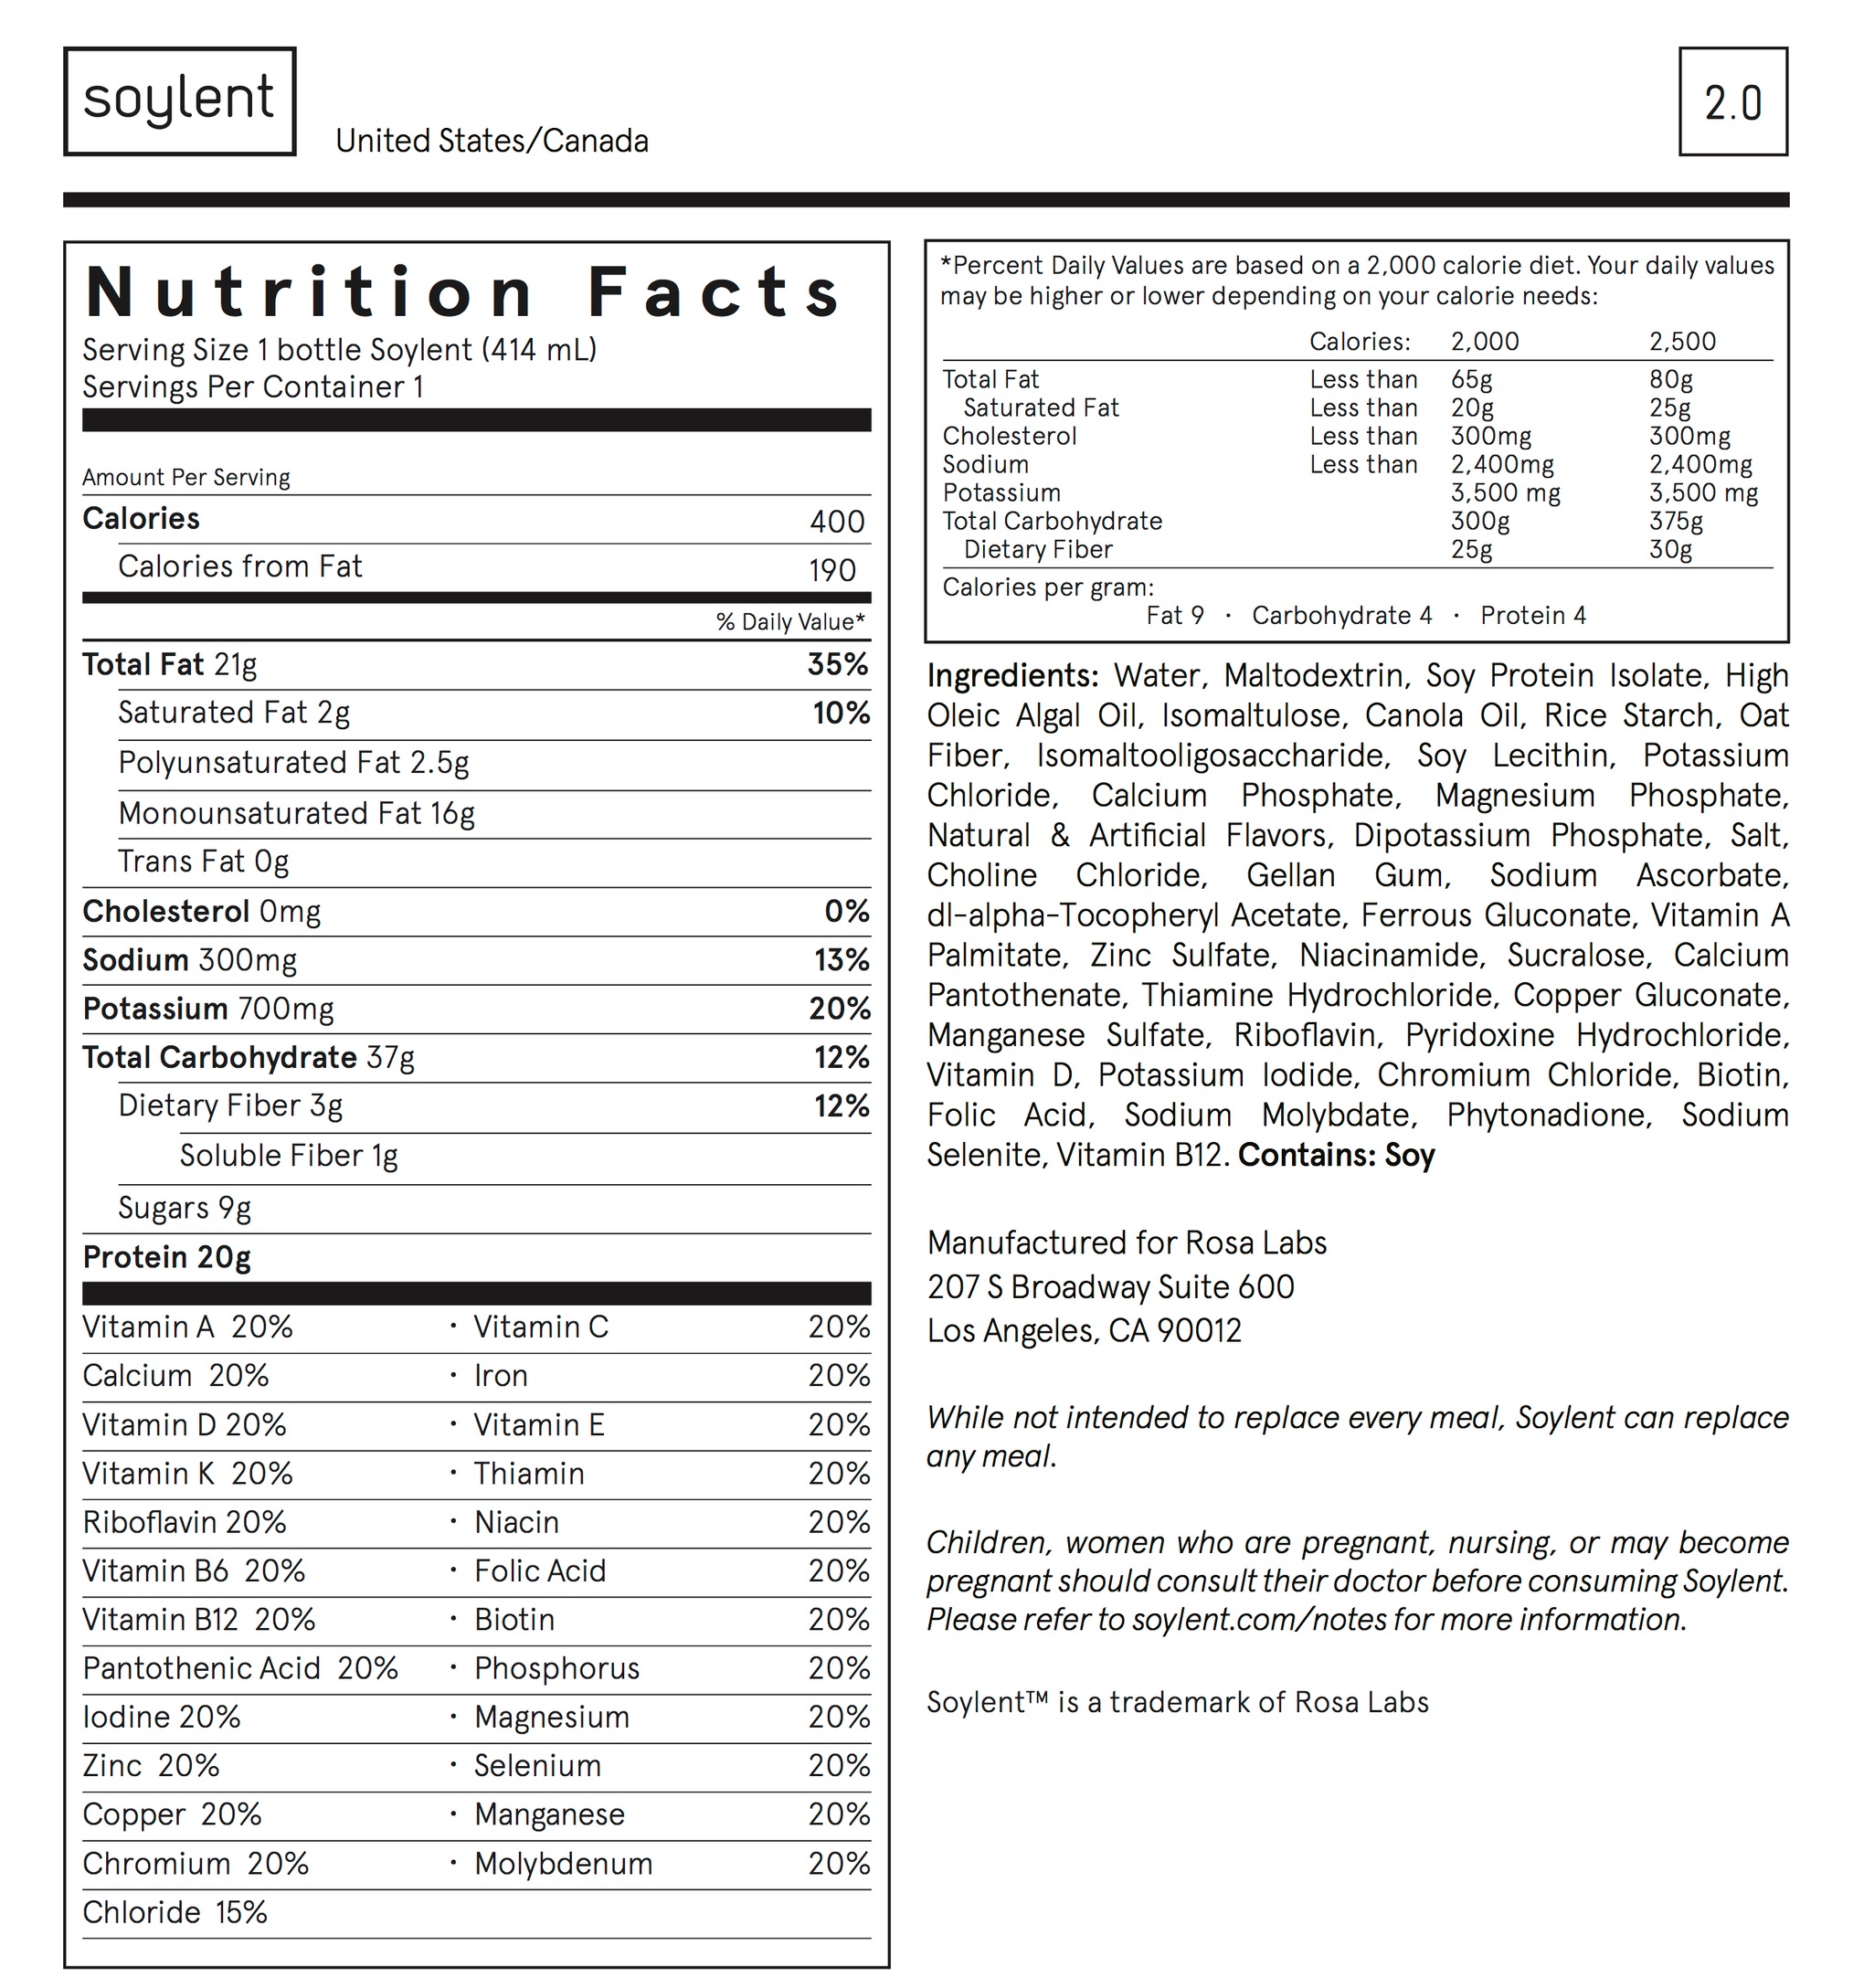
Soylent
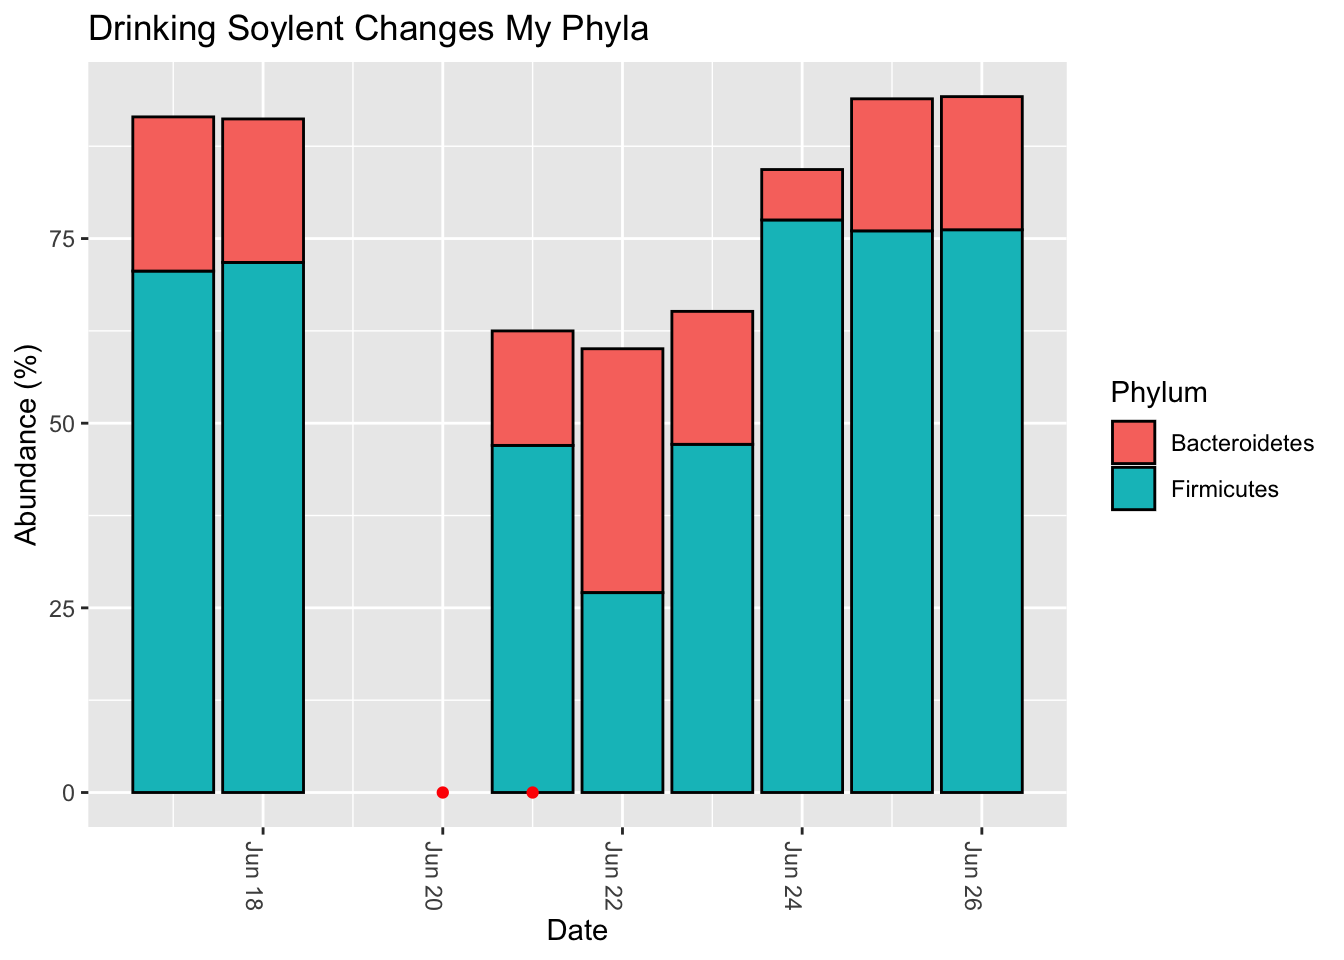
A team of undergraduates at the University of California Berkeley conducted an experiment with 14 people to see if the nutrition drink Soylent would change the microbiome. They found that it increased the ratio of Bacteroidetes to Firmicutes by a significant amount. How about me?
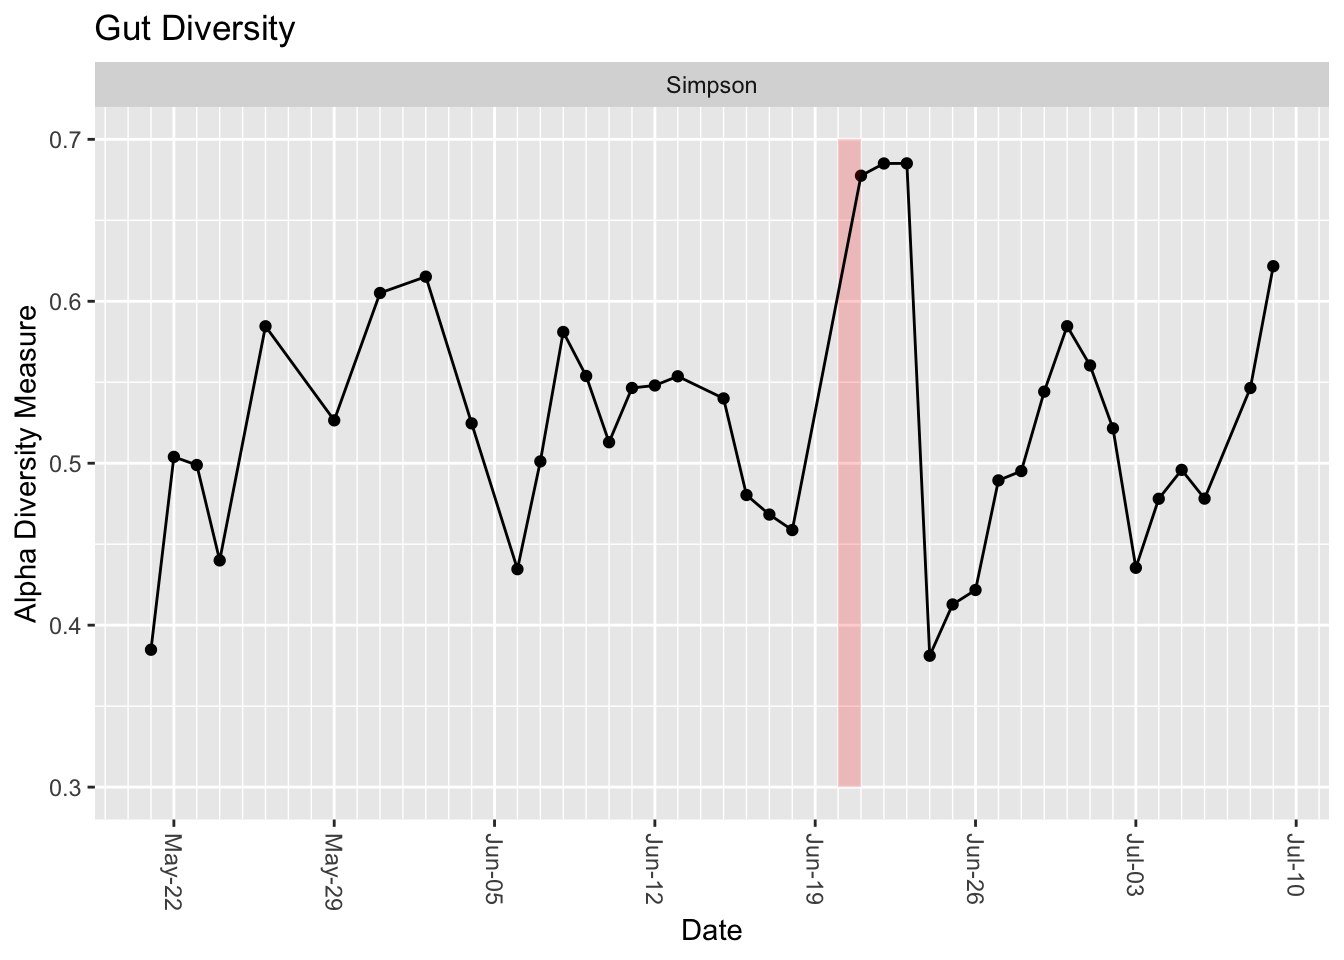
Interestingly, looking back through my daily microbiome samples to see which dates I tried Soylent, I got this: (Figure 13.10)
The red dots are dates when I drank Soylent. Unfortunately, the samples failed on two of the dates in this chart, so I’m unable to see how my gut microbiome looked immediately before taking the Soylent, but still, isn’t it strange that my F/B ratio was reasonably stable until then?
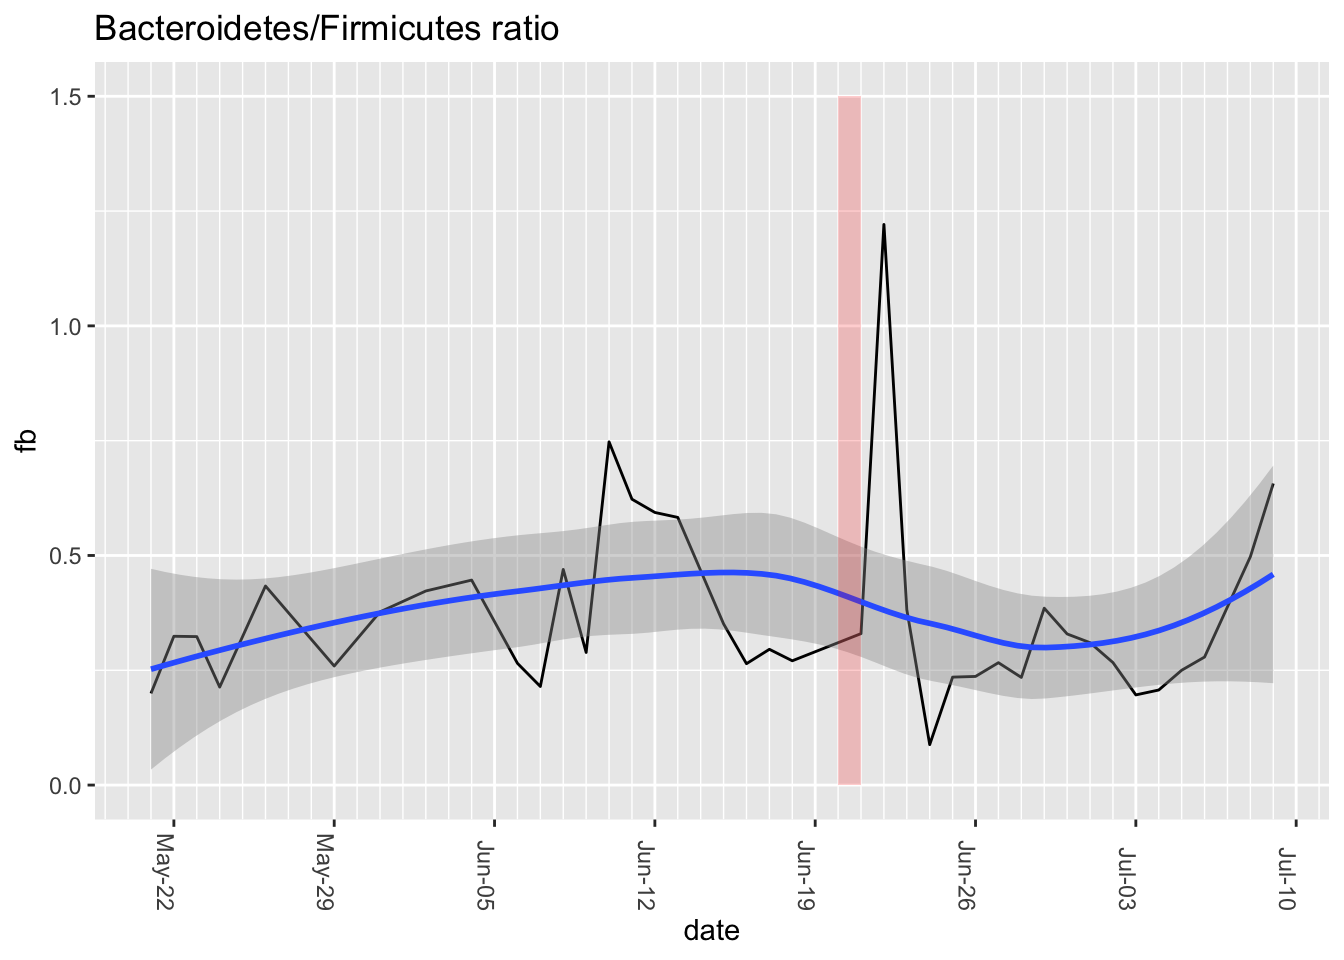
The shift is more dramatic if we look at a longer time frame, the weeks before and after the Soylent drinking (Figure 13.11)
This is by no means a confirmation of the results of their experiment, since mine was just an ad hoc test for two days among many other types of food-eating and tests that I regularly conduct on myself. That said, it is odd that I find a significant shift in that ratio, in the same direction as in their published trial.
Why would this be?
The nutritional label gives some possible clues. (Figure 13.12)
One of the main ingredients, maltodextrin, is a man-made polysaccharide popular as a food additive for its usefulness as a thickener and texturizer. Usually synthesized from corn or wheat, it has been added to food products since the 1950s and is now in something like 60% of all packaged foods. It also has some well-known effects on the microbiome, at least in mice, and on the ability of some bacteria to form biofilms. I couldn’t find any studies in humans that specifically look at the affect on the microbiome, except now this Berkeley study.
The Soylent web site explains that the maltodextrin is there to provide carbohydrates. Mixed with oat flour and other fibers to give it an overall lower glycemic index, it’s naturally easy to digest and a quick source of energy. That sounds like a recipe that should significantly affect the microbiome, especially if you use it, as intended, as your main source of food.
Interestingly, my gut diversity seems to have increased sharply right after drinking the Soylent, followed by a crash a few days later.
The diversity calculated in this chart is a very crude measurement that tries to summarize a complex ecology into a single number, and as you can see it tends to vary sharply from day-to-day anyway. That said, it’s not that variable over time, and the few days after Soylent seem notably higher than the rest of the period measured. I’m betting this is really caused by the fact that I was visiting another city at the time, so the increase is likely related to travel more than the food itself. Still, something for future research to consider.
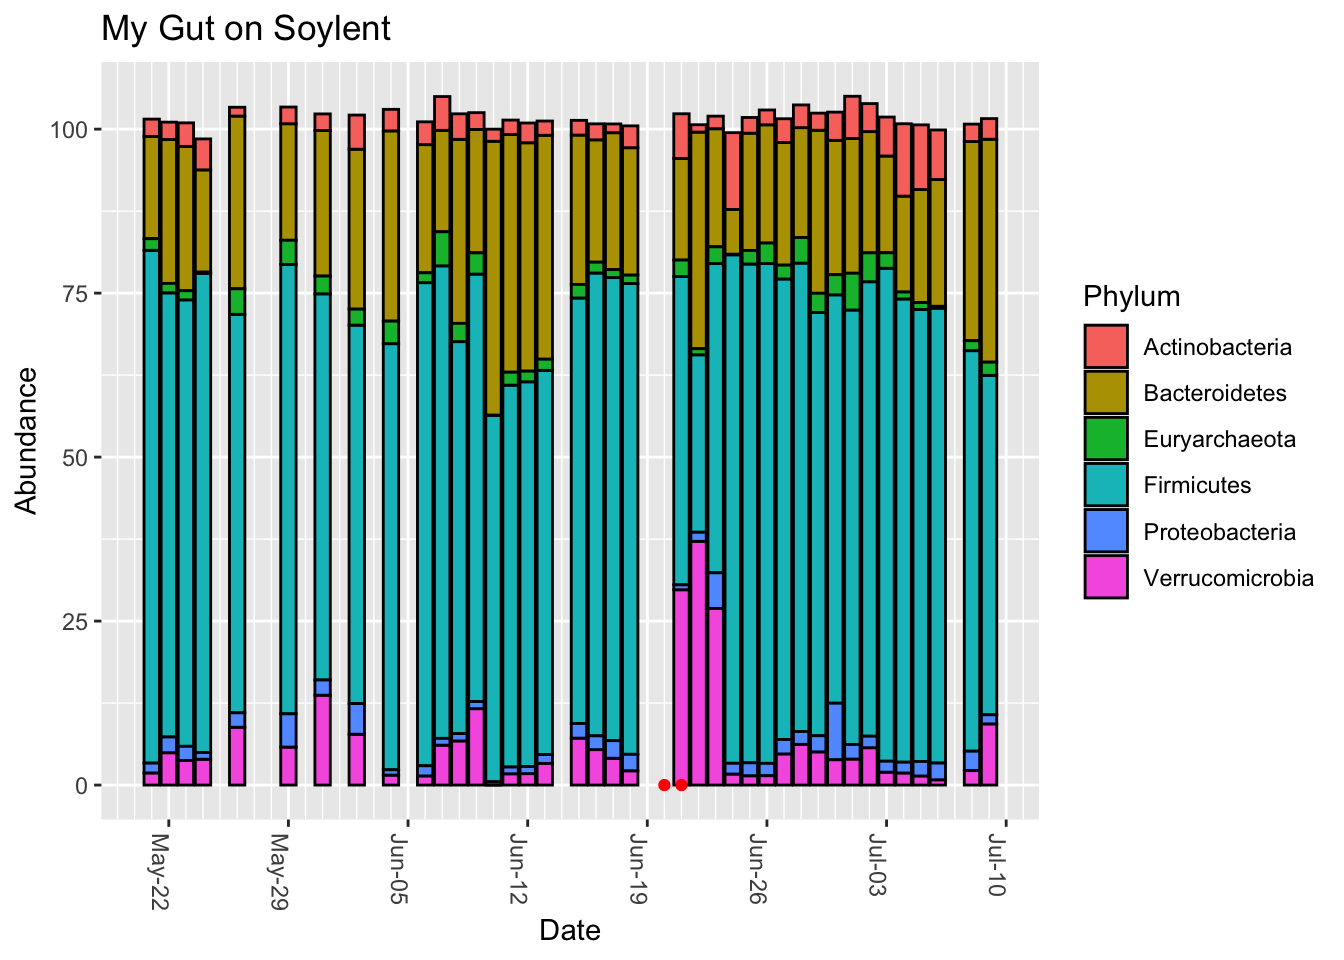
Finally, let’s look at the overall phyla-level breakdown. (Figure 13.14)
Interestingly, the days after Soylent drinking show that the Firmicutes has been replaced by Verrucomicrobia, the phylum that contains Akkermansia. The affect lasts a few days, and it’s unusual compared to the rest of the sampling period, so I doubt it’s a coincidence. Still, it’s very hard to tell the cause.
More details are available on the Mycrobes site of the student group that did the experiment. There is also a lively Reddit discussion.
Hsu, Ryan H., Dylan M. McCormick, Mitchell Lee J. Seitz, Lauren M. Lui, Harneet S. Rishi, and Adam P. Arkin. 2017.
“An Interventional Soylent Diet Increases the Bacteroidetes to Firmicutes Ratio in Human Gut Microbiome Communities: A Randomized Controlled Trial,” October, –.
https://doi.org/10.1101/200881.
Muñoz-González, Carolina, Carolina Cueva, M. Ángeles Pozo-Bayón, and M. Victoria Moreno-Arribas. 2015.
“Ability of Human Oral Microbiota to Produce Wine Odorant Aglycones from Odourless Grape Glycosidic Aroma Precursors.” Food Chemistry 187 (November): 112–19.
https://doi.org/10.1016/j.foodchem.2015.04.068.
Natsch, Andreas, Hans Gfeller, Peter Gygax, Joachim Schmid, and Gonzalo Acuna. 2003.
“A Specific Bacterial Aminoacylase Cleaves Odorant Precursors Secreted in the Human Axilla.” Journal of Biological Chemistry 278 (8): 5718–27.
https://doi.org/10.1074/jbc.M210142200.
Nickerson, Kourtney P, Rachael Chanin, and Christine McDonald. 2015.
“Deregulation of Intestinal Anti-Microbial Defense by the Dietary Additive, Maltodextrin.” Gut Microbes 6 (1): 78–83.
https://doi.org/10.1080/19490976.2015.1005477.